


Concept of RSI
The Relative strength index ( RSI )was developed by J. Welles Wilder. It compares the strength of up days versus down days to determine how well a stock performs relative to itself. It provides a numerical value between 0 and 100. The readings above 70 show bullishness and readings below 30 show bearishness. Let’s explore how to use the RSI effectively.
How to Use RSI?
- Overbought/Oversold Levels :
- RSI above 70: Overbought
- RSI below 30: Oversold
- Adjust these levels based on the security’s behavior.
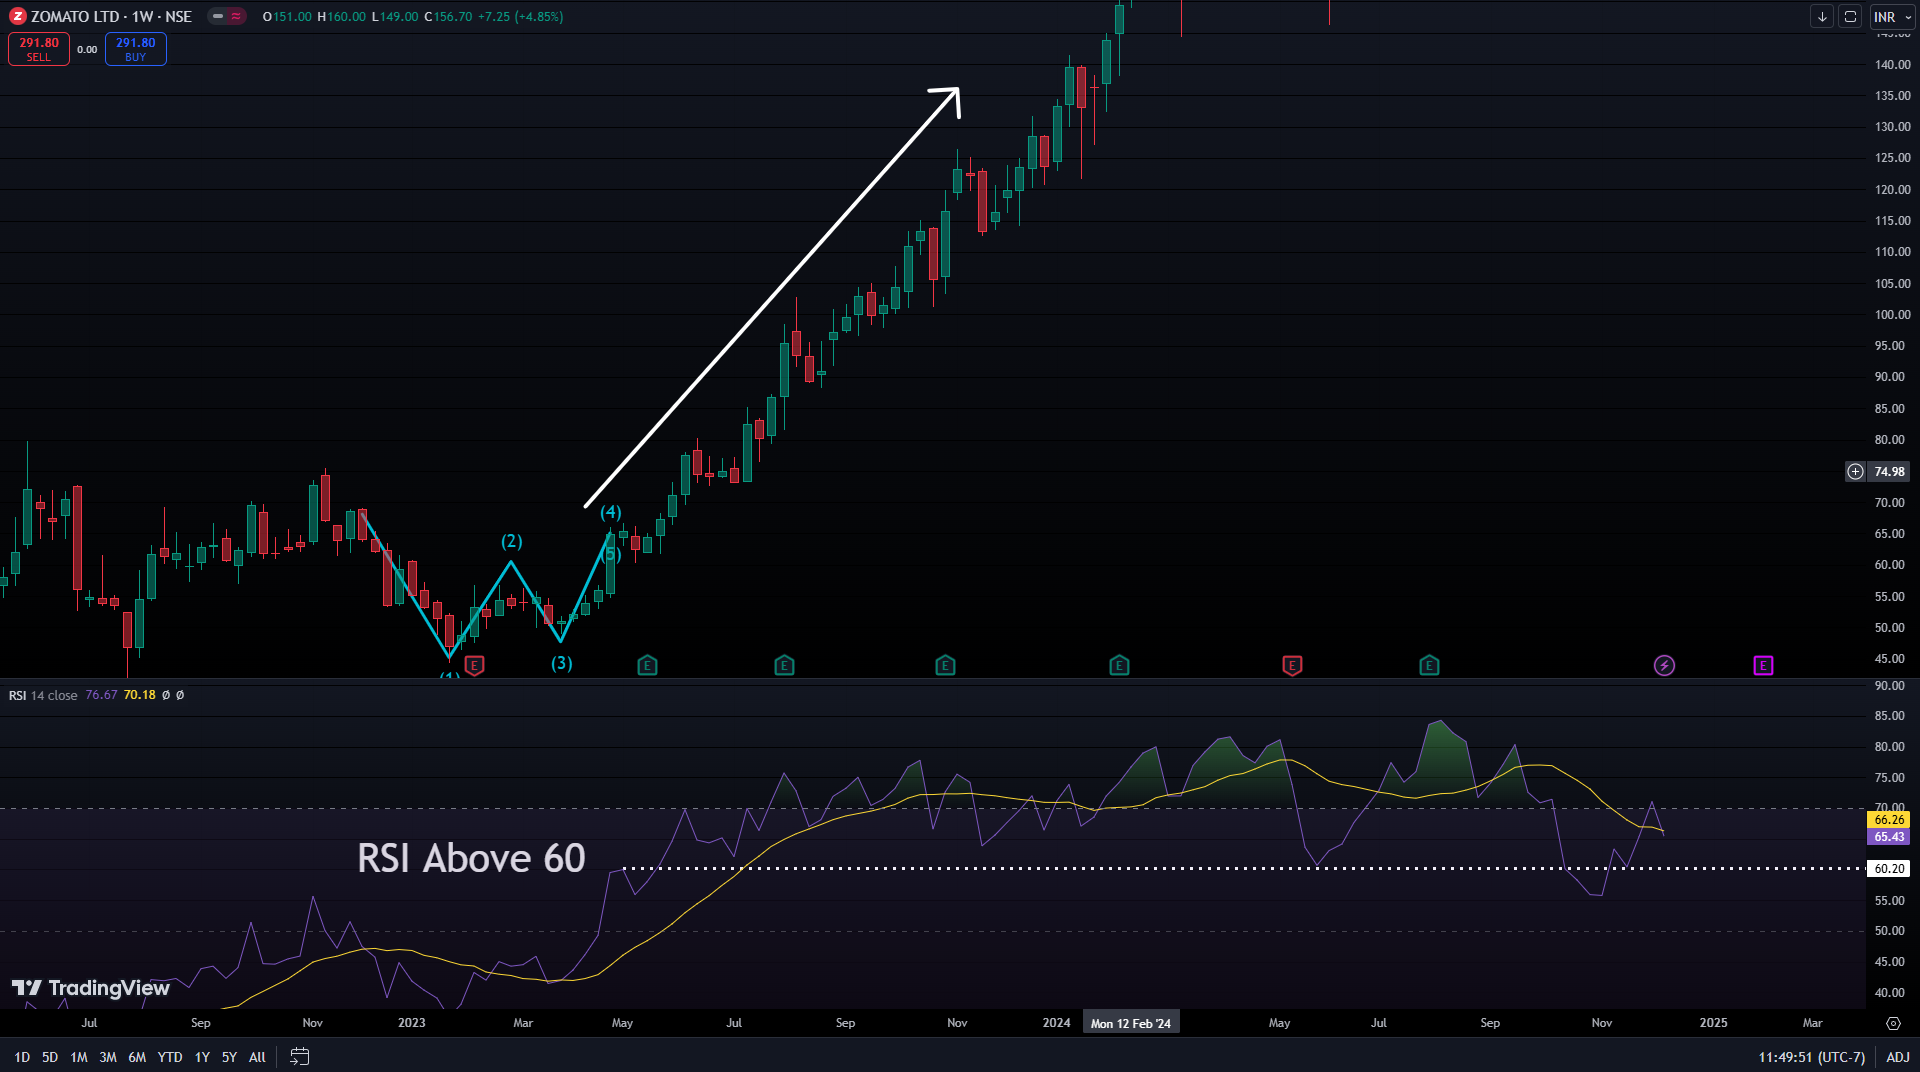
- Remember, during strong trends, RSI may stay in overbought or oversold territory for extended periods.
- Patterns and Trending Market:
- RSI often forms chart patterns (e.g., double tops, bottoms) not visible on price charts.
- Look for support or resistance levels on the RSI.
- Divergences:
If prices make new highs or lows that RSI doesn’t confirm, it signals a potential reversal.
What is Relative Strength Index?
J.Welles Wilder created the RSI and detailed it in his book New Concepts in Technical Trading Systems in June 1978. The Relative Strength Index (RSI) compares the strength of up days versus down days to determine how well a stock performs relative to itself. This number is calculated and has a range of 0 to 100.
A reading of 70 or higher is considered bullish, while a reading of 30 or lower is considered bearish. It is generally helpful to track periods of overbought or oversold conditions.
1.Overbought\Oversold
When the RSI rises above 70, it is considered overbought; when it falls below 30, it is considered oversold. These traditional levels can also be adjusted to fit the security better if necessary. For example, if security consistently reaches the overbought level of 70, you may want to increase this level to 80.
Please remember that during strong trends, the RSI may remain in overbought or oversold territory for extended periods.
xxxx example : watch in class
2. Patterns
RSI also frequently forms chart patterns that may or may not be visible on the underlying price chart, such as double tops, bottoms, and trend lines. Look for support or resistance on the RSI as well.
xxxx example : watch in class
3. Trending Market
The RSI tends to remain in the 40 to 90 range during an uptrend or bull market, with the 40-50 zone acting as support. The RSI stays between 10 and 60 during a downtrend or bear market, with the 50-60 zone acting as resistance. These ranges will vary depending on the RSI settings and the strength of the underlying trend of the security or market.
xxxx example : watch in class
If underlying prices make a new high or low that the RSI does not confirm, the divergence may indicate a price reversal. A Top Swing Failure occurs when the RSI makes a lower high and moves lower below a previous low. If the RSI makes a higher low and rises, a Bottom Swing Failure occurs.
Having understood how we can use RSI Indicator in trading, let us discuss some index trading strategies:
xxxx example : watch in class
Trading Strategies using RSI
1. RSI with MACD
The green circle in this relative strength index example represents the times we receive entry signals from both indicators.
We notice the relative strength index leaving an oversold condition slightly more than an hour after the morning open, which is a clear buy signal. In addition, the MACD performs a bullish crossover the following period, which is our second signal.
We go long on this stock because we have two matching signals from the indicators. First, we appear to be at the start of a long-term bullish trend.
xxxx example : watch in class
2. RSI with MA Crossover
We will match the RSI with the moving average indicator in this trading strategy. The 4-period and 13-period moving averages will be used for the moving averages.
When an RSI crossing 50-line coincides with a supportive crossover of the moving averages, we will buy or sell the stock. On that note, we will hold the position until we receive a reversal signal from one of the two indicators or see a divergence on the chart.
First, let’s clear up some confusion about MA cross-exit signals. A regular deviation from the moving average is an insufficient reason to exit a trade. Therefore, before exiting the market, we recommend waiting for a candle to close above both lines of the moving average cross.
From the daily chart of State Bank of India Ltd., we can see how RSI crosses the 50-line co-incidence with MA crossovers and gives a bullish signal to enter the stock. On the other hand, we can exit the stock when the RSI crosses the 50 lines from above and there is a Bearish MA Crossover.
xxxx example : watch in class
3. RSI and Price Action Trading
For this strategy, we’ll use the relative strength index signals in conjunction with any price action indicator, such as candlesticks, chart patterns, trend lines, channels, etc.
You will need an RSI signal and a price action signal – candle pattern, chart pattern, or breakout – to enter a trade. The goal is to hold each trade until a contrarian RSI signal or price movement confirms that the move has ended.
In the daily chart of State Bank of India Ltd, we can see that the candlesticks formed a Morning Star Pattern, and RSI also entered the bullish territory. Both the RSI and candlestick patterns give us bullish signals to enter the stock.
xxxx : watch in class
Also read .. Meaning of Price Action
1. RSI with Super trend:
The Super trend indicator helps filter out false RSI signals, especially in volatile markets. Combining Super trend (10,3) with RSI(14) yields less favorable outcomes. Conversely, pairing RSI(7) with Super trend (5,1.5) produces intriguing results, effectively filtering out numerous false signals.
Strategy:
Buy Signal: Initiate a Buy action upon receiving a Buy signal in RSI(7), succeeded by a Buy indication in Super trend (5,1.5) within 2-3 candles.
Sell Signal: Execute a Sell action upon obtaining a Sell signal in RSI(7), followed by a Sell indication in Super trend (5,1.5) within 2-3 candles.
xxxx : watch in class

Leave a Reply Cancel reply