
11 Most Important Candlesticks Pattern
What is Candlesticks ?
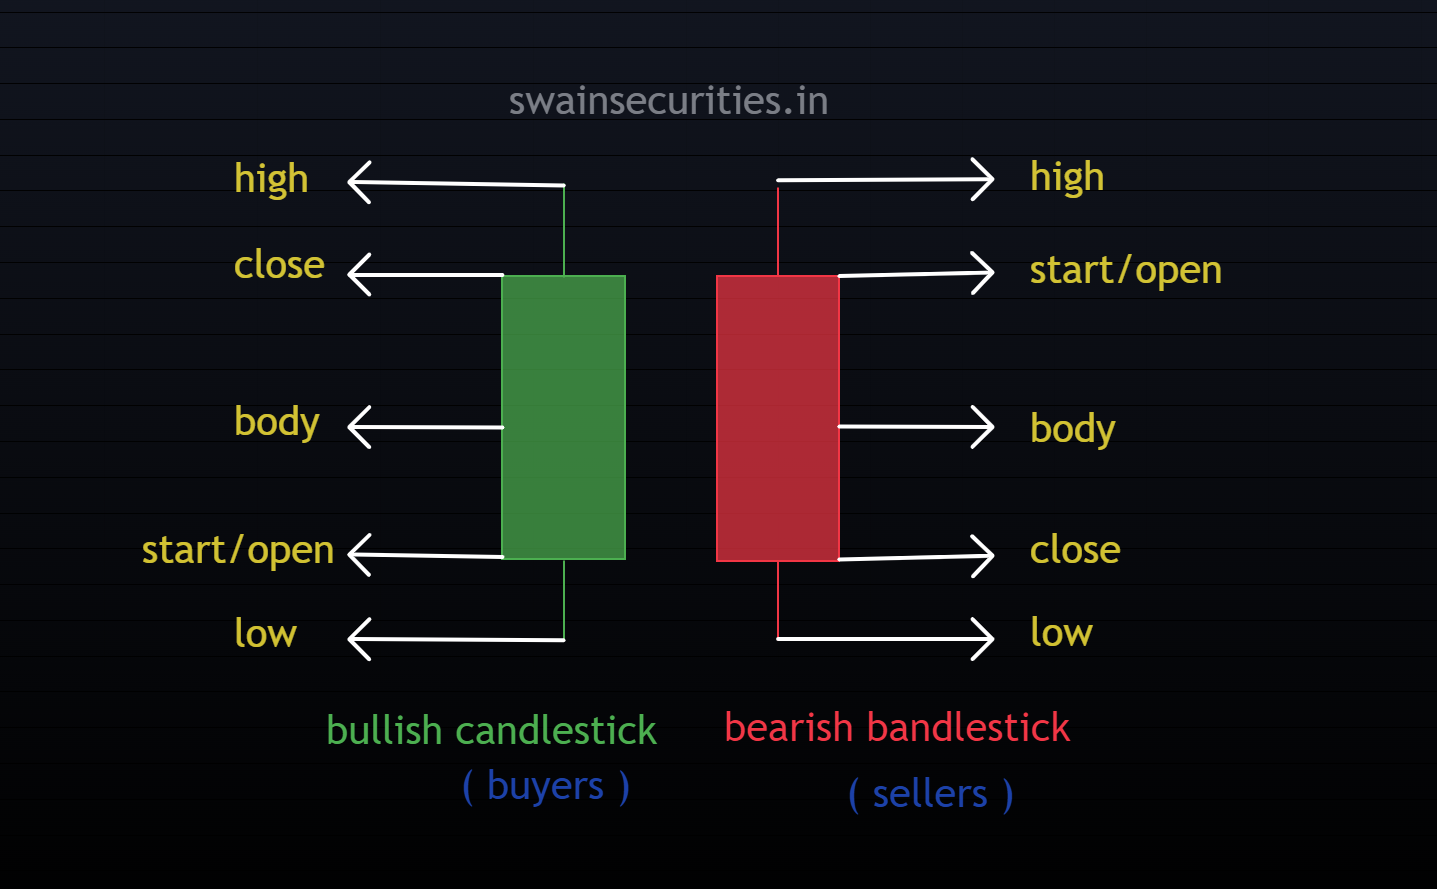
A candlestick is a visual representation of how the price of an asset, such as a stock, cryptocurrency, or commodity, changed over a given time period. Instead of just showing a single line of prices, a candlestick packs four different pieces of information—the open, high, low, and close—into a single, easy-to-read shape. This makes it easier for traders to understand the “story” of the buyers and sellers fighting during that time period. Each candlestick is made up of two main parts and represents a specific time period, like one minute, one day, or one week: The Body, or the thick part, displays the gap between the opening and closing prices for that time period. The thin lines, known as the Wicks or Shadows, originate at the body’s top and bottom. They show the highest and lowest prices reached during that time.

candlesticks
By looking at the body and wicks, you can instantly see who was in control—buyers or sellers.
Reading the Colors
The color of the body tells you the direction the price moved:
Green (or White) = Bullish: The price closed higher than it opened. Buyers were in control. The bottom of the body is the opening price, and the top is the closing price.
Bearish: The price closed lower than when it opened (red or black). The sellers were in charge. The opening price is at the body’s top, and the closing price is at the body’s bottom. Here is an interactive simulator where you can adjust the four key prices to see how the candlestick changes shape and color in real-time:
The key takeaway is that a long body indicates intense buying or selling pressure. The price swung wildly, but it ended up closing close to where it started (indecision), as evidenced by the long wick with a small body.
Types of Candlesticks
-
Bullish Engulfing
A bullish engulfing pattern is a powerful two-candle formation that signals a potential reversal from a downtrend to an uptrend. It visually depicts a sudden, aggressive momentum shift in which sellers are completely dominated by buyers. How to Find It A pattern must meet three strict requirements in order to be considered a genuine bullish engulfing: The Trend: The stock must be in a clear downtrend (prices have been falling leading up to the pattern).

bullish engulfing
Candle 1 (The Setup): A relatively small red (bearish) candle. This demonstrates that sellers are still lowering the price, albeit with less vigor. Candle 2 (The Engulf): A large, bullish candle in the color green. The body of this green candle must completely cover (or “engulf”) the entire body of the previous red candle.
(Note: The reversal signal is thought to be much stronger if the wicks or shadows are covered by the green body; however, this is not required.) The Psychology Behind It
Think of it as a tug-of-war where one side suddenly collapses:
Day 1: The sellers (bears) are still in control, pushing the price down to form the red candle. However, the body’s small size suggests that they are losing steam. Day 2: Right before the market opens, sellers attempt to lower the price one more time (this is why the green candle frequently opens slightly lower than the red candle closed). However, a massive wave of buyers (bulls) steps in at this low price. They not only prevent the drop but also completely overwhelm the sellers, driving up the price to close higher than when it opened the previous day. The bears have given up. Key insight: A bullish engulfing pattern is much more reliable when it happens at a major level of support, or after a long, exhausting downtrend. If you see this pattern in the middle of a choppy, sideways market, it doesn’t mean much.
2. Bearish Engulfing
Opposit of Bullish Engulfing .

bearish engulfing 1

bearish engulfing
3. Doji Candlesticks;
a) Standard Doji
A unique candlestick pattern called a standard doji has the shape of a plus sign or a cross. It occurs when the opening and closing prices of a stock are nearly identical. Visually, this means the candle has almost no “body”—just a horizontal line with wicks sticking out of the top and bottom.
What Does It Mean?
Uncertainty A doji is the ultimate picture of a market tug-of-war ending in a tie.
The upper wick of the candle was created by buyers, and the lower wick was created by sellers during the candle’s time period. However, by the time the period came to an end, neither party was able to maintain control, and the price settled back exactly where it had begun. Everything depends on context. A doji only means “pause” and tells you nothing else. To trade a doji, you have to look at what happened before it appeared:

standard doji
After a Long Uptrend: If a stock has been surging for days and suddenly forms a doji, it suggests the buyers are exhausted. This could signal a reversal back down.
After a Long Downtrend: If a stock has been falling for a long time and forms a doji, the sellers may be losing steam. This could point to a reverse uptrend. In a Sideways Market: If the market is already chopping around sideways, a doji is mostly meaningless noise.
Important point: Don’t stress about the open and close being exactly the same. If a stock opens at $150.00 and closes at $150.02 with large wicks, traders still read that as a doji.
Note; In case of bearish reversal pattern

doji bearish
b) Dragonfly Doji
The standard doji can be found in a unique, highly bullish variant known as a Dragonfly Doji. It appears to be a capital “T.” It occurs when the low price of a stock is significantly lower than the opening, closing, and high prices of the stock. This creates a candlestick with no real body, no upper wick, and a very long lower wick.

Dragonfly doji

Dragonfly Doji 1
The Psychology: A Massive Rejection
The long lower wick of a Dragonfly Doji tells a dramatic story about the battle between buyers and sellers:
The Fall: As soon as the period began, sellers aggressively took control and drove the price significantly lower. The Reversal: However, at that low point, a massive wave of buyers stepped in. They considered the stock incredibly cheap at that level.
The Recovery: The buyers completely overwhelmed the sellers, pushing the price all the way back up to close exactly where it opened (which was also the high of the period).
This demonstrates a vehement opposition to lower prices. When you see a Dragonfly Doji at the bottom of a downtrend, it’s a strong signal that the sell-off has exhausted itself and a bullish reversal is likely.
Important insight: The bullish signal on a Dragonfly Doji is more significant the longer the lower wick is. A small wick indicates a quiet market, whereas a large wick indicates that the bulls won a significant battle.
c)Gravestone Doji
A Gravestone Doji is a reversal pattern that is extremely bearish and resembles an upside-down “T,” which is the complete opposite of the Dragonfly Doji. It occurs when the high price of a stock is significantly higher but the stock’s opening, closing, and low prices are all exactly (or nearly exactly) the same. A candlestick with no real body, a long upper wick, and no lower wick is created as a result.

gravestone doji

gravestone doji
The Psychology of Bullying: The long upper wick of a Gravestone Doji represents a failed breakout and a massive rejection by sellers:
The Surge: At the beginning of the period, buyers take over aggressively and push the price significantly higher, frequently attempting to break above a resistance level. The Rejection: However, a massive wave of sellers enters at that new high. The buyers are completely overwhelmed by them. The Collapse: The sellers send the price plunging back to where it started, which is also the period’s low, erasing all gains. This pattern is a strong indication that the bullish momentum is dead (hence the name “gravestone”) and that a reversal to the downside is likely when it appears near the top of an extended uptrend or a significant level of resistance. Key insight: A Gravestone Doji is most powerful when traded in context. It is a high-probability signal to take profits or consider a short position if you spot one just as the stock reaches an all-time high or a recognized resistance line.
4. Hammer
A single candlestick pattern known as a “hammer” can indicate a potential Bullish reversal. It looks exactly like its name suggests: it has a small “head” (the body) at the top and a long “handle” (the lower wick) extending below it.To officially qualify as a hammer, the lower wick must be at least twice as long as the real body, and there should be little to no upper wick.

hammer

hammer
The Psychology of the Hammer;
The story of an aggressive intraday reversal is told by a hammer: The Sell-Off: The stock is already moving in a downward direction. When the period opens, sellers continue to dominate, driving the price drastically lower to form that long wick.
The Turnaround: The sellers are at their lowest point and have exhausted themselves. Buyers step in with massive volume, recognizing the stock is oversold.
The Close: The buyers completely reverse the trend, bringing the price back to where it was when it first opened, or very close to where it was at the close. Whether the body is green (closed slightly above the open) or red (closed slightly below the open) is irrelevant. The long wick is what matters—it proves that a massive wave of selling was completely absorbed and overpowered by buyers.
Build a hammer candlestick with this interactive simulator and observe how the proportions of the body to the wick define the pattern: The key takeaway is that a hammer is only a hammer if it strikes during a downtrend. If you see this exact same shape at the top of an uptrend, it is called a “Hanging Man” and is actually a bearish signal, not a bullish one.
5. Inverted Hammer
Note:( Inverted hammer workes in Both bullish and Bearish reversal case according to chart pattern )
In technical analysis, an inverted hammer is a single candlestick pattern that typically indicates a potential bullish reversal. It suggests that buyers are beginning to step in and push prices higher and appears to be at the bottom of a downtrend. How to Spot It
To be considered a true inverted hammer, the candlestick must meet a few specific criteria:
Small Real Body: The open, close, and low prices are all very close to each other, forming a small “body” at the lower end of the trading range.
Long Upper Shadow (Wick): The line above the body ought to be at least twice as long as the actual body. Little to No Lower Shadow: There should be almost no wick extending below the bottom of the body.
The body can be either green (bullish/close higher than open) or red (bearish/close lower than open), but a green body is typically regarded as a slightly stronger reversal signal. Color does not strictly matter.

inverted hammer

inverted hammer 1

inverted hammer 2
The Psychology Behind the Pattern;
When you see an inverted hammer during a downtrend, it tells a specific story about the battle between buyers and sellers during that trading period:
Sellers start in control: The downtrend initially continues as the period opens.
Buyers surge: A wave of buying pressure enters the market, driving the price significantly higher (creating the long upper wick).
The sellers manage to push the price back down to close close to the open, but they are unable to push it down to new significant lows. The sellers push back, but they lose momentum. Even though buyers were unable to hold the high, their massive counterattack demonstrates that bearish momentum is waning and that bulls are prepared to intervene. Inverted Hammer vs. Shooting Star
A common trap for new traders is confusing the inverted hammer with a shooting star.
They have the same small body and long upper wick on the outside. The difference is entirely based on where they appear in the trend:
Inverted Hammer: Appears at the bottom of a downtrend (Bullish signal).
Shooting Star: Appears at the top of an uptrend (Bearish signal).
How the Inverted Hammer Is Traded by Traders.
Like most single-candle patterns, seasoned traders never trade an inverted hammer in isolation.
Wait for Confirmation: The most critical step. Traders wait for the next candlestick to close. The reversal is confirmed if the subsequent candle is a strong bullish green candle that closes above the inverted hammer’s body. Check Volume: A strong conviction is added to the signal when there is a valid inverted hammer and a lot of trading. Set Stop Losses: If entering a long position based on this pattern, traders typically place their stop-loss slightly below the low of the inverted hammer candle to protect against a false signal.
Note; In case of bullish reversal

inverted hammer 3
6. Twezeer Bottom
In technical analysis, an inverted hammer is a single candlestick pattern that typically indicates a potential bullish reversal. It appears at the bottom of a downtrend and suggests that buyers are starting to step in and push prices higher.

tweezer bottom

tweezer bottom 1

twezeer bottom 2
How to Find It.
The candlestick needs to meet a few specific requirements in order to be considered a genuine inverted hammer: Small Real Body: At the lower end of the trading range, the open, close, and low prices are all very close to one another, forming a small “body.” Long Upper Shadow (Wick): The line extending above the body should be at least twice as long as the real body itself.
Little to No Lower Shadow: There should be almost no wick extending below the bottom of the body.
The body can be either green (bullish/close higher than open) or red (bearish/close lower than open), but a green body is typically regarded as a slightly stronger reversal signal. Color does not strictly matter. The mentality that drives the pattern During a downtrend, when you see an inverted hammer, it tells a specific story about the battle between buyers and sellers: The downtrend initially continues as the period begins, and sellers take control. Buyers surge: A wave of buying pressure enters the market, driving the price significantly higher (creating the long upper wick).
The sellers manage to push the price back down to close close to the open, but they are unable to push it down to new significant lows. The sellers push back, but they lose momentum. The fact that buyers were able to mount a massive counter-attack—even if they couldn’t hold the high—shows that the bearish momentum is fading and bulls are ready to step in.
Hammer inverted versus The Shooting Star New traders frequently fall into the trap of mistaking the inverted hammer for a shooting star. They have the same small body and long upper wick on the outside. The difference is entirely based on where they appear in the trend:
Inverted Hammer: Appears at the bottom of a downtrend (Bullish signal).
Shooting Star: Appears at the top of an uptrend (Bearish signal).
How Traders Trade the Inverted Hammer
Like most single-candle patterns, seasoned traders never trade an inverted hammer in isolation.
Wait for Confirmation: The most critical step. Traders wait for the next candlestick to close. If the next candle is a strong bullish green candle that closes above the inverted hammer’s body, it confirms the reversal.
Check Volume: A valid inverted hammer accompanied by high trading volume adds strong conviction to the signal.
Set Stop Losses: If entering a long position based on this pattern, traders typically place their stop-loss slightly below the low of the inverted hammer candle to protect against a false signal.
7. Inside Bar
A two-candlestick pattern known as an inside bar is a sign of market consolidation or uncertainty. It occurs when all of a candle’s price range falls completely within the previous candle’s high and low range.
How to Find It .
Look for the following specific characteristics to correctly identify an inside bar pattern: The Mother Bar: This is the first candle in the pattern. In most cases, the setup’s high and low boundaries are set by a large candle. The Inside Bar: The second candle is here. Its highest point (including the upper wick) must be lower than the mother bar’s high, and its lowest point (including the lower wick) must be higher than the mother bar’s low.

inside bar
Color Doesn’t Strictly Matter: The pattern is valid regardless of whether the candles are bullish (green/white) or bearish (red/black), though the context of the trend matters greatly.
The mentality that drives the pattern An inside bar indicates a brief halt in market momentum. Contraction: After a period of directional movement (represented by the mother bar), market participants take a breath.
Equilibrium: Neither the buyers nor the sellers have enough strength or conviction to push the price beyond the extremes of the previous period. Physically, the trading range gets smaller. Imminent Expansion: In technical analysis, contraction-like periods of low volatility are almost always followed by expansion-like periods of high volatility. The inside bar behaves like a coiled spring that is waiting for its energy to flow out.
How Traders Trade the Inside Bar
The inside bar is primarily traded as a breakout pattern because it suggests consolidation. The pattern itself does not inherently indicate which way the price will move; rather, it indicates that once the price breaks out of the range of the mother bar, a significant move is likely. The most common way to trade it is with trend continuation breakouts. During a strong, established uptrend or downtrend, traders look for inside bars. They view the inside bar as a brief pause and place trades in the direction of the dominant trend once the price breaks past the mother bar.
Reversal Breakouts: When an inside bar forms precisely at a major, long-term support or resistance level, it may indicate a reversal if the trend is reversed. Entry and Stops: Traders typically place buy or sell stop orders just above the high (or below the low) of the mother bar to catch the momentum as the breakout occurs. Stop-loss orders are often placed on the opposite side of the inside bar to manage risk in case of a “fakeout” (a false breakout).
8. Piercing Line
The Piercing Line is a two-candle, bullish reversal pattern that typically occurs at the bottom of a downtrend. It signals that the bears (sellers) are losing control and the bulls (buyers) are taking over, often preceding a potential upward move in price.

piercing line 1

piercing line
How to Identify It
A pattern must meet these specific requirements in order to be considered a genuine piercing line: Preceding Trend: The market must be in a clear, established downtrend.
Candle 1 (The Bearish Candle): A large red (or black) candle that confirms the sellers are still driving the price down.
A large green (or white) candle that opens lower than the close of the previous day (creating a “gap down”) is the bullish candle. The “Pierce”: This is the most crucial step. The green candle must push back up and close above the 50% mark (the midpoint) of the first candle’s real body.
The reversal signal is deemed invalid and weak if the second candle does not progress past the 50% halfway point of the red candle. If the second candle completely engulfs the entire first candle, it becomes a stronger pattern known as a Bullish Engulfing pattern.
The Psychology Behind the Pattern
The Piercing Line visually maps a dramatic shift in market sentiment:
Panic and surrender: The gap down at the opening of the second candle demonstrates that sellers were eager to sell their positions overnight or at the opening. The Reversal: A surge of buying pressure steps in instead of the price continuing to fall. The bulls absorb all the selling supply and push the price aggressively higher.
The Squeeze: Short-sellers begin to feel the pain by closing above the midpoint of the massive drop of the previous day. As a result, they may buy back their positions to cover, which further fuels the anticipated upward trend. How Traders Use It
Traders usually wait for confirmation before acting on a Piercing Line, as a two-candle pattern isn’t always enough to guarantee a long-term reversal.
The third candle is looked at by traders as confirmation. The reversal is confirmed if the third candle opens and continues to move higher. Entry Point: Typically, buyers enter a “long” position (buying the asset) close to the open of the third confirming candle or the close of the second candle. Stop-Loss: To protect against a false signal, a stop-loss is typically placed just below the lowest point (the bottom wick) of the second (bullish) candle.
Supporting Indicators: This pattern is much more reliable when it occurs at a major support level, or when momentum indicators (like the RSI) show the asset was heavily oversold.
9. Dark Cloude Cover
The Dark Cloud Cover is a two-candle, bearish reversal pattern that appears at the top of an uptrend. The Piercing Line’s exact mathematical inverse is represented by it. The Dark Cloud Cover is a two-candle bearish reversal pattern that appears at the top of an uptrend. It indicates that bullish momentum is exhausting and bears (sellers) are seizing control, frequently foreshadowing a price decline. The Piercing Line’s exact mathematical inverse is represented by it. It signals that bullish momentum is exhausting and bears (sellers) are seizing control, often foreshadowing a downward move in price.The Dark Cloud Cover is a two-candle, bearish reversal pattern that appears at the top of an uptrend. It is the exact mathematical inverse of the Piercing Line. It signals that bullish momentum is exhausting and bears (sellers) are seizing control, often foreshadowing a downward move in price.
How to Determine It For a pattern to qualify as a true Dark Cloud Cover, it must meet these specific criteria:
Preceding Trend: The market must be in a clear, established uptrend.
Candle 1 (The Bullish Candle): A large green (or white) candle that confirms buyers are still driving the price up.
Candle 2 (The Bearish Candle): A large red (or black) candle that opens higher than the previous day’s close (creating a “gap up”).
The “Cover”: The red candle must push aggressively down and close below the 50% mark (the midpoint) of the first candle’s real body.
The reversal signal is weak and typically only a minor pullback if the second candle fails to close below that 50% halfway point of the green candle. A Bearish Engulfing pattern occurs when the body of the first candle is completely swallowed up by the body of the second candle. The Psychology Behind the Pattern
The Dark Cloud Cover illustrates a sudden and aggressive trap set by sellers:
Euphoria and the Trap: The gap up at the open of the second candle shows that buyers were overly eager, jumping in to push the asset to new highs.
The Reversal: The buying momentum hits a wall immediately. A massive wave of selling pressure steps in, overwhelming the buyers and forcing the price downward.
The Panic: By closing below the midpoint of the previous day’s gains, late buyers who bought at the top are suddenly trapped in losing positions. The bears’ control is confirmed by their haste to sell and cut losses, which adds downward pressure. What Traders Do With It Because a two-candle formation isn’t always enough to guarantee a major trend shift, traders look for extra validation before entering a trade.
Traders keep an eye on the third candle for confirmation. If it opens lower and continues the downward trajectory, the reversal is confirmed.
Entry Point: Sellers often enter a “short” position (betting against the asset) near the close of the second candle or the open of the third confirming candle.
Stop-Loss: A stop-loss is typically set just above the highest point (the top wick) of the second bearish candle to protect against a false signal or an abrupt uptrend continuation. Supporting Indicators: This pattern is highly reliable when it forms near a major resistance level, or when momentum indicators (like the RSI) signal the asset is heavily overbought.

dark cloude cover example

dark cloude cover
10. Sootong Star
The Shooting Star is a bearish reversal pattern with just one candle that appears at the top of an uptrend. Its form resembles a star falling from the sky and leaving a long trail behind it, as the name suggests. It serves as an important warning sign that buyers have run out of steam and sellers are refusing to accept higher prices.

shooting star candlesticks

How to Determine It
The candle’s precise proportions are very strict because it is a one-candle pattern. To qualify as a true Shooting Star, it must meet these criteria:
Preceding Trend: There needs to be an established uptrend in the market. Small Real Body: The open, close, and low are all roughly near the same price, creating a small, compressed body at the very bottom of the candle. (The body can be green or red, but a red body is thought to be a little more pessimistic). Long Upper Shadow (Wick): The upper wick must be at least twice the length of the real body.
Little to No Lower Shadow: The candle’s bottom should have almost no wick. The key takeaway is that location is everything. If you see this exact same candle shape at the bottom of a downtrend, it is no longer a Shooting Star—it is a bullish reversal pattern known as an Inverted Hammer.
The Psychology Behind the Pattern
The Shooting Star visually captures a fierce intraday battle where the buyers ultimately lose:
The Bullish Surge: When the candle opens, buyers are still feeling confident from the ongoing uptrend. They aggressively push the price up to new highs, creating the long upper wick.
Hitting a Wall: At the peak, the buying pressure dries up completely. The price reaches a significant supply block (sellers waiting to sell their positions). The Rejection: Sellers overwhelm the remaining buyers and ruthlessly drive the price all the way back down, forcing the candle to close near where it opened. This creates a lengthy “trail” of locations where potential buyers attempted to enter but were violently rejected. How Traders Use It
A Shooting Star is a powerful signal, but traders rarely act on it blindly without additional evidence because it is only one candle. Confirmation: The most critical step. After the Shooting Star, traders wait for the next candle to open and close lower. This confirms the bears have officially taken the steering wheel.
Entry Point: Typically, sellers will take a “short” position close to the end of the confirming candle. Stop-Loss: To protect themselves if the uptrend suddenly resumes, traders place a stop-loss just above the highest point (the very tip of the wick) of the Shooting Star.
Context is important: The pattern is much stronger if the long upper wick is rejecting a trendline, a moving average, or a known historical resistance level.
11. Twezeer top
The Tweezer Top is a bearish reversal pattern with two candles that occurs at an uptrend’s peak. It gets its name because the matching high points of the two candles look like the tips of a pair of tweezers. It shows that buyers have repeatedly reached a stumbling block that they can’t break through, allowing sellers to take control.

twezeer top

twezeer top 1
How to Identify It
A very specific price rejection defines a Tweezer Top. To spot a valid pattern, look for these criteria:
Preceding Trend: There needs to be an established uptrend in the market. A green (or white) candle that maintains the upward momentum from Candle 1 (The Bullish Candle). It usually closes near its high.
The bearish candle, Candle 2, is a red or black candle that appears immediately after. The “Tweezers” (Matching Highs): The most critical feature is that both candles share the exact same (or nearly identical) high price. This could be the tips of their upper wicks or the tops of their actual bodies. The key takeaway is that a Tweezer Top is really just a “double top” chart pattern that only lasts for two trading periods. The fact that the price was rejected twice at the same level is more important than the specific colors of the bodies. The mentality that drives the pattern The Tweezer Top reveals a tenacious struggle in which buyers eventually exhaust themselves against a firm supply wall: The First Strike: During the first candle, buyers are confident. They push the price up to a new high, but run into resistance and finish the session.
The Second Attempt—and Its Failure: On the second candle, buyers attempt to increase the price above the high of the previous session. However, they hit a brick wall at the exact same price level.
The Surrender: Because the buyers cannot break through that ceiling, they lose their momentum. The bearish second candle is produced when sellers aggressively step in to capitalize on this weakness.
How Traders Use It
Like most two-candle patterns, the Tweezer Top is a warning sign that requires additional context before executing a trade.
Confirmation: Traders look for the third candle to open and close lower than the second candle. This confirms that the downward reversal is actually taking hold.
Entry Point: Sellers often enter a “short” position near the close of the confirming third candle.
Stop-Loss: Because the matching highs represent a proven area of resistance, traders will typically place a tight stop-loss just above that shared high point.
Supporting Indicators: This pattern is highly reliable when those matching highs align perfectly with a longer-term historical resistance level, a trendline, or a Fibonacci retracement level.








Leave a Reply