
RSI Indicator Explained: Uses, Divergence, Range Shift & Best Time Frame for Trading
Learn everything about the RSI (Relative Strength Index), including how it works, RSI divergence, range shift, best time frame, trading and investing strategies, and common mistakes. A complete beginner-friendly guide.
What is RSI (Relative Strength Index)?
The Relative Strength Index (RSI) is one of the most popular technical indicators used in the stock market. It helps traders understand whether a stock, index, or any financial asset is overbought (priced too high) or oversold (priced too low).
The RSI was developed by J. Welles Wilder Jr. in 1978 and has since grown to be one of the momentum indicators that traders around the world rely on the most. Unlike moving averages, RSI measures the speed and strength of price movements.
The RSI value always ranges between 0 and 100.
Above 70 – Overpriced. below 30 – Oversold. Around 50 – Neutral Momentum
However, experienced traders know that RSI should never be used alone. It works better when combined with price action, volume, support and resistance, or trend analysis.
How Does RSI Work?
RSI compares the average gains and average losses over a selected period.
The default calculation uses 14 periods, known as RSI (14).
RSI rises when buyers dominate the market. When sellers dominate, RSI falls.
Simply put,
A higher RSI indicates more buying pressure. A lower RSI indicates intense selling pressure. Rather than predicting prices in the future, RSI measures momentum strength at the moment.
Understanding RSI Levels
RSI Above 70
If the RSI is above 70, there has been a lot of buying pressure. The price will not always immediately decrease as a result of this. In strong bull markets, RSI can remain above 70 for several days or even weeks.
RSI Below 30
An RSI below 30 indicates heavy selling pressure.
Again, this does not guarantee an immediate price reversal.
The RSI may stay below 30 for a long time during strong downtrends.
RSI Around 50
The 50 level acts as a balance point.
Above 50 = Buyers have more control.
Below 50 = Sellers have more control.
Many professional traders pay more attention to the 50 level than the traditional 30/70 level
Major Uses of RSI
1. Identify Overbought Stocks
When RSI moves above 70, the market may be overextended.
Traders look for signs of profit booking or price correction.
2. Identify Oversold Stocks
When RSI falls below 30, selling pressure may be nearing exhaustion.
If supported by price action, it can signal a buying opportunity.
3. Find Trend Strength
The RSI is a great way to measure momentum. Rising RSI = Strengthening trend
Falling RSI = Weakening trend
4. Trend Reversals in Spot.
Often, RSI moves in a different direction than price. Traders can better prepare for potential reversals thanks to this early warning. 5. Confirm Breakouts
If price breaks a resistance level while RSI is rising above 60, the breakout is generally considered stronger.
Similarly, if price breaks support with RSI below 40, bearish momentum is stronger.
Which time frame provides the most reliable RSI signals?
5-Minute Timeline
Most suitable for intraday traders. Produces many signals but also more false signals.
15-Minute Timeline
One of the most reliable time frames for day trading.
Offers a good balance between signal frequency and accuracy.
Daily Chart
Ideal for swing traders and investors.
Signals are fewer but generally more reliable.
The Weekly Chart
Useful for long-term investing and identifying major market trends.
Should RSI Be Used for Trading or Investing?
RSI is widely used by:
Intraday traders
Swing traders
Futures traders
Options traders
It helps identify:
Entry points
Exit points
Momentum changes
Potential reversals
RSI for Investing
Long-term investors can also benefit from RSI.
Instead of making quick trades, investors use RSI to:
During brief periods of weakness, acquire high-quality stocks. Avoid purchasing after extended rallies.
Add positions during healthy market corrections.
RSI should complement fundamental analysis rather than replace it.
RSI Divergence
One of the strongest RSI concepts is divergence.
Divergence occurs when the price and RSI move in opposite directions.
It often signals that momentum is changing.
Bullish RSI Divergence
Bullish divergence happens when:
Price makes a lower low.
RSI makes a higher low.
This suggests that selling pressure is weakening, even though the price has fallen further.
A bullish divergence can indicate a potential upward reversal.
Bearish RSI Divergence
Bearish divergence occurs when:
Price makes a higher high.
RSI makes a lower high.
This indicates that buying momentum is weakening despite higher prices.
A bearish divergence may precede a downward reversal.
Hidden RSI Divergence
Hidden divergence helps identify trend continuation.
Hidden Bullish Divergence
Price forms a higher low.
RSI forms a lower low.
This often suggests the uptrend is likely to continue.
Hidden Bearish Divergence
Price forms a lower high.
RSI forms a higher high.
This often signals continuation of a downtrend.
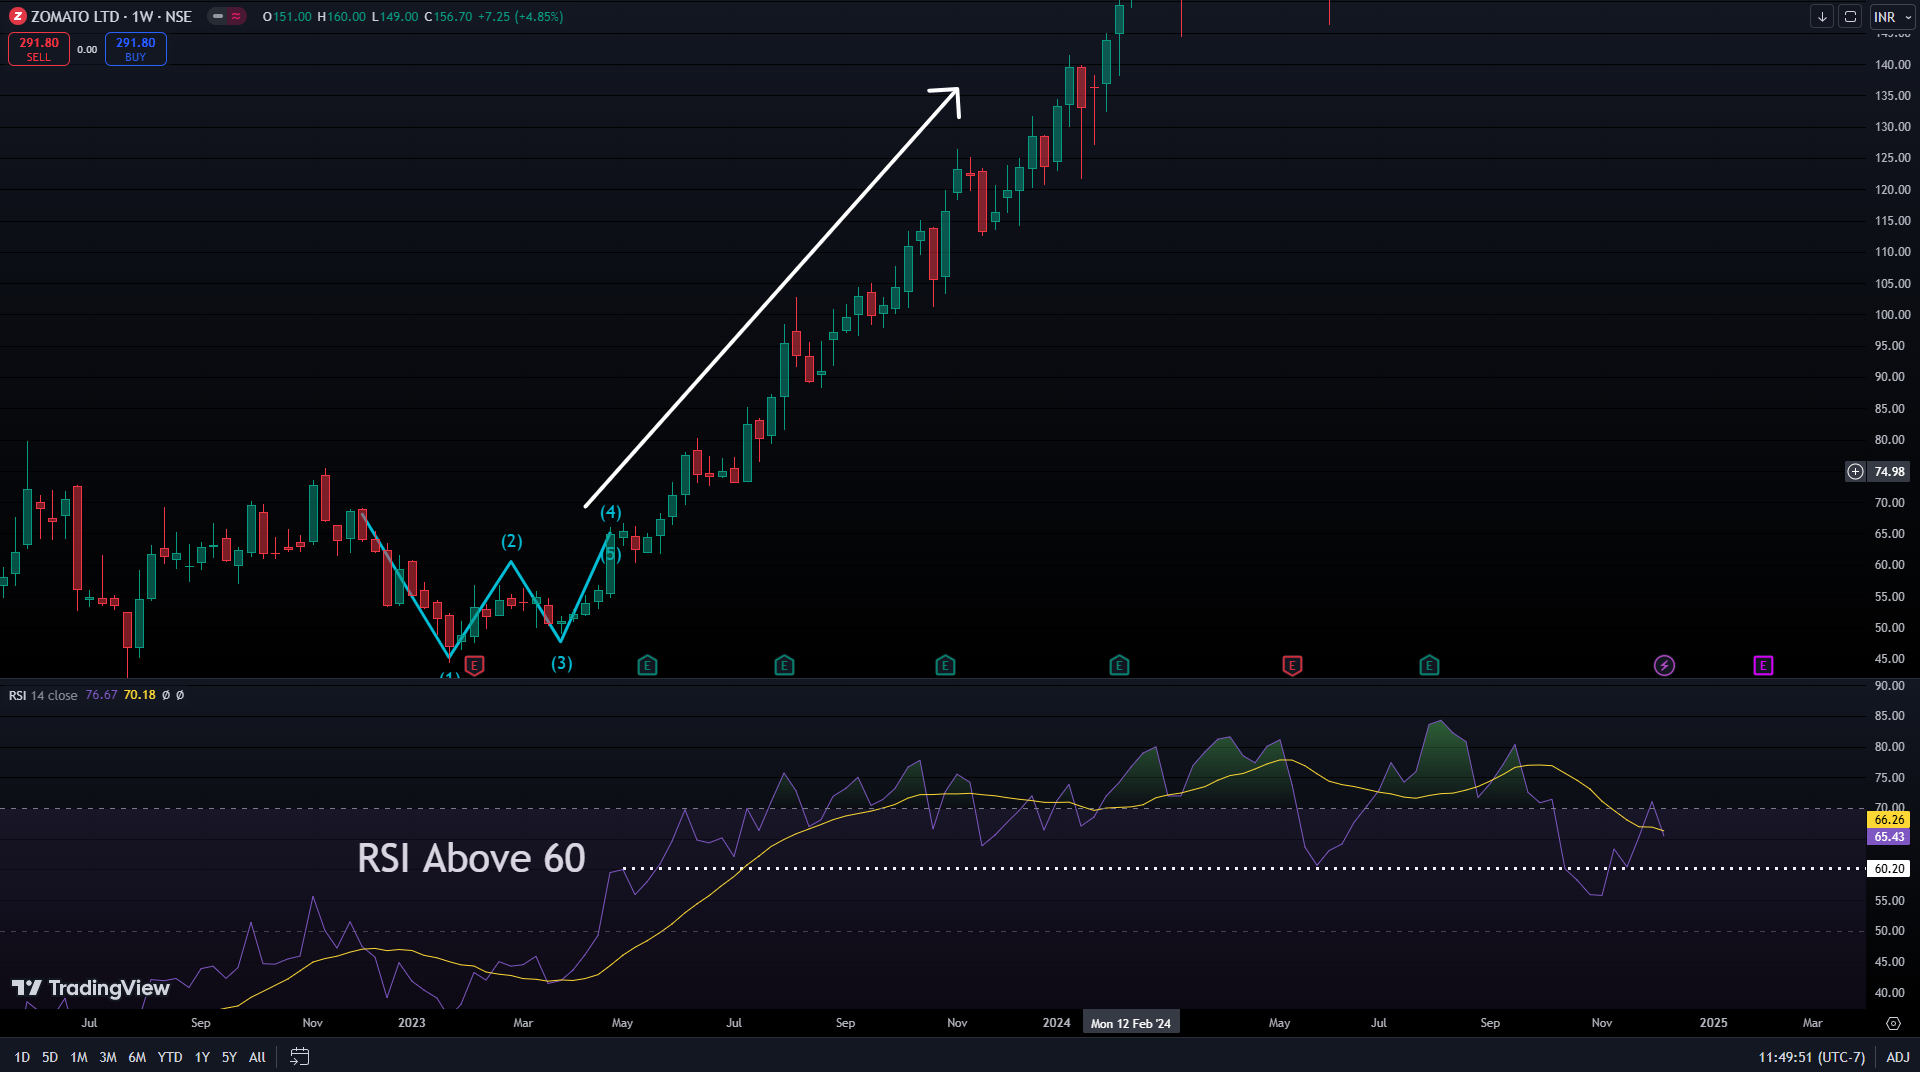
RSI Range Shift
Many beginners overlook RSI Range Shift, but it is one of the most effective ways to understand trend strength.
Instead of focusing only on the 30 and 70 levels, range shift examines where RSI spends most of its time.
Bullish Range Shift
In a strong uptrend:
RSI usually stays between 40 and 90.
Pullbacks often stop near 40–50 before the trend resumes.
This indicates persistent buying pressure.
Bearish Range Shift
In a strong downtrend:
RSI generally stays between 10 and 60.
Rallies often fail near 50–60.
This reflects sustained selling pressure.
Sideways Market
When RSI oscillates between 30 and 70 without establishing a new range, the market is often moving sideways.
In such conditions, RSI signals may be less reliable, and traders should wait for a clear breakout.
Best RSI Trading Strategy
One simple approach is:
Step 1
Determine the market trend using higher time frames.
Step 2
Wait for RSI to move into an overbought or oversold zone.
Step 3
Look for confirmation through:
Support and opposition Candlestick patterns
Volume analysis
Trendlines
Step 4
Enter the trade only after price confirms the setup.
Step 5
Always use a stop-loss to manage risk.
Common RSI Mistakes
Many traders misuse RSI. Avoid these common errors:
Buying immediately because RSI is below 30.
Selling right away because the RSI is higher than 70. ignoring the overall trend in the market. Trading without confirmation from price action.
Using RSI alone without other analysis tools.
Ignoring higher time-frame signals.
Benefits of RSI
Easy to understand and apply.
Effective across stocks, indices, forex, commodities, and cryptocurrencies.
Identifies momentum shifts early.
Highlights potential reversals.
Suitable for beginners and experienced traders.
Works on multiple time frames.
Limitations of RSI
Can generate false signals in strong trends.
Overbought does not always mean prices will decline.
Oversold does not always mean prices will rise.
Less effective in highly volatile, range-bound markets.
Should always be combined with price action, volume, and trend analysis.
Practical Tips for Using RSI
Use RSI with support and resistance for better entry points.
Combine RSI with volume analysis to confirm momentum.
Watch for bullish and bearish divergences near important price levels.
Monitor RSI range shifts to understand whether the market is trending or consolidating.
Check a higher time frame before taking trades on a lower time frame.
Focus on risk management by setting stop-loss and position size before entering any trade.
Questions and Answers (FAQs)
1. What is the best RSI setting?
The default 14-period RSI is the most widely used and works well for most trading styles.
2. Is RSI good for beginners?
Yes. RSI is one of the easiest momentum indicators to learn and use, especially when combined with price action.
3. Can RSI predict market reversals?
Divergence and momentum shifts, on the other hand, can serve as early warning signs for reversals. RSI cannot accurately predict reversals.
4. Can RSI be used for investing over the long term? Yes. Investors often use weekly or monthly RSI to identify attractive buying opportunities during market corrections.
5. Should RSI alone be used? No. RSI works best when combined with trend analysis, support and resistance, volume, and candlestick patterns.
Final Thoughts
The Relative Strength Index (RSI) is a versatile momentum indicator that can help traders and investors assess market strength, identify potential reversal points, and improve decision-making. Advanced concepts like RSI divergence and RSI range shift provide deeper insights into trend quality and momentum than the standard 30 (oversold) and 70 (overbought) levels. No indicator is perfect. RSI should not be used as a standalone trading system but rather as a confirmation tool. By combining RSI with price action, volume analysis, support and resistance, and disciplined risk management, traders can reduce false signals and make more informed decisions.








Leave a Reply