
What Is Volume Analysis in the Stock Market? A Complete Beginner’s Guide
Introduction
Many traders spend most of their time looking at price charts, but they often ignore one of the most important factors in trading—volume. Price tells you what is happening in the market, while volume tells you how strongly buyers and sellers believe in that price movement.
Volume analysis is one of the most reliable methods used by professional traders to confirm trends, identify reversals, and avoid false breakouts. Whether you trade stocks, futures, commodities, or options, understanding volume can significantly improve your trading decisions.
In this article, you will learn what volume analysis is, how it works, why it is important, and how you can use it effectively in your trading strategy.
What Is Volume?
Volume is the total number of shares or contracts traded during a specific period of time. It demonstrates the market’s participation level. For example:
If 50,000 shares of a company are traded in one day, the daily volume is 50,000.
If only 2,000 shares are traded, the volume is considered low.
Volume reflects the interest of buyers and sellers. High volume means many market participants are actively trading, while low volume indicates less interest.
What Is Volume Analysis?
Volume analysis is the process of studying trading volume along with price movements to understand market strength.
Instead of looking only at whether the price is rising or falling, traders ask questions such as:
- Are buyers supporting the price rise?
- Is the selling pressure increasing?
- Is the trend likely to continue?
- Is a reversal about to happen?
Volume provides clues about the strength behind every price movement.
Simply put,
Price tells the direction. Volume tells the conviction.
Why Is Volume Important?
Volume is important because it confirms whether a market move is genuine or weak.
Imagine two situations:
Situation 1
A stock rises from ₹500 to ₹520 with very high volume.
This indicates strong buying interest. The fact that so many investors support the price increase makes the move more dependable.
Situation 2
The same stock rises from ₹500 to ₹520 with very low volume.
This indicates weak participation. Only a few traders are buying, so the price rise may not last long.
This is why experienced traders always analyze volume before entering a trad
How Volume Analysis Works
Volume works on the basic principle of demand and supply.
Increasing Demand
When buyers are willing to purchase more shares than sellers want to sell:
Price increases
Volume usually increases
This indicates a strong sense of optimism.
Expanding the Supply
When sellers become more active than buyers:
Price falls
Volume often increases
This suggests strong bearish sentiment.
Low Participation
When neither buyers nor sellers are active:
Price moves slowly
Volume remains low
During this time, markets frequently remain sideways.
The Relationship Between Volume and Price
Understanding the relationship between price and volume is the foundation of volume analysis.
1. Price Up + Volume Up
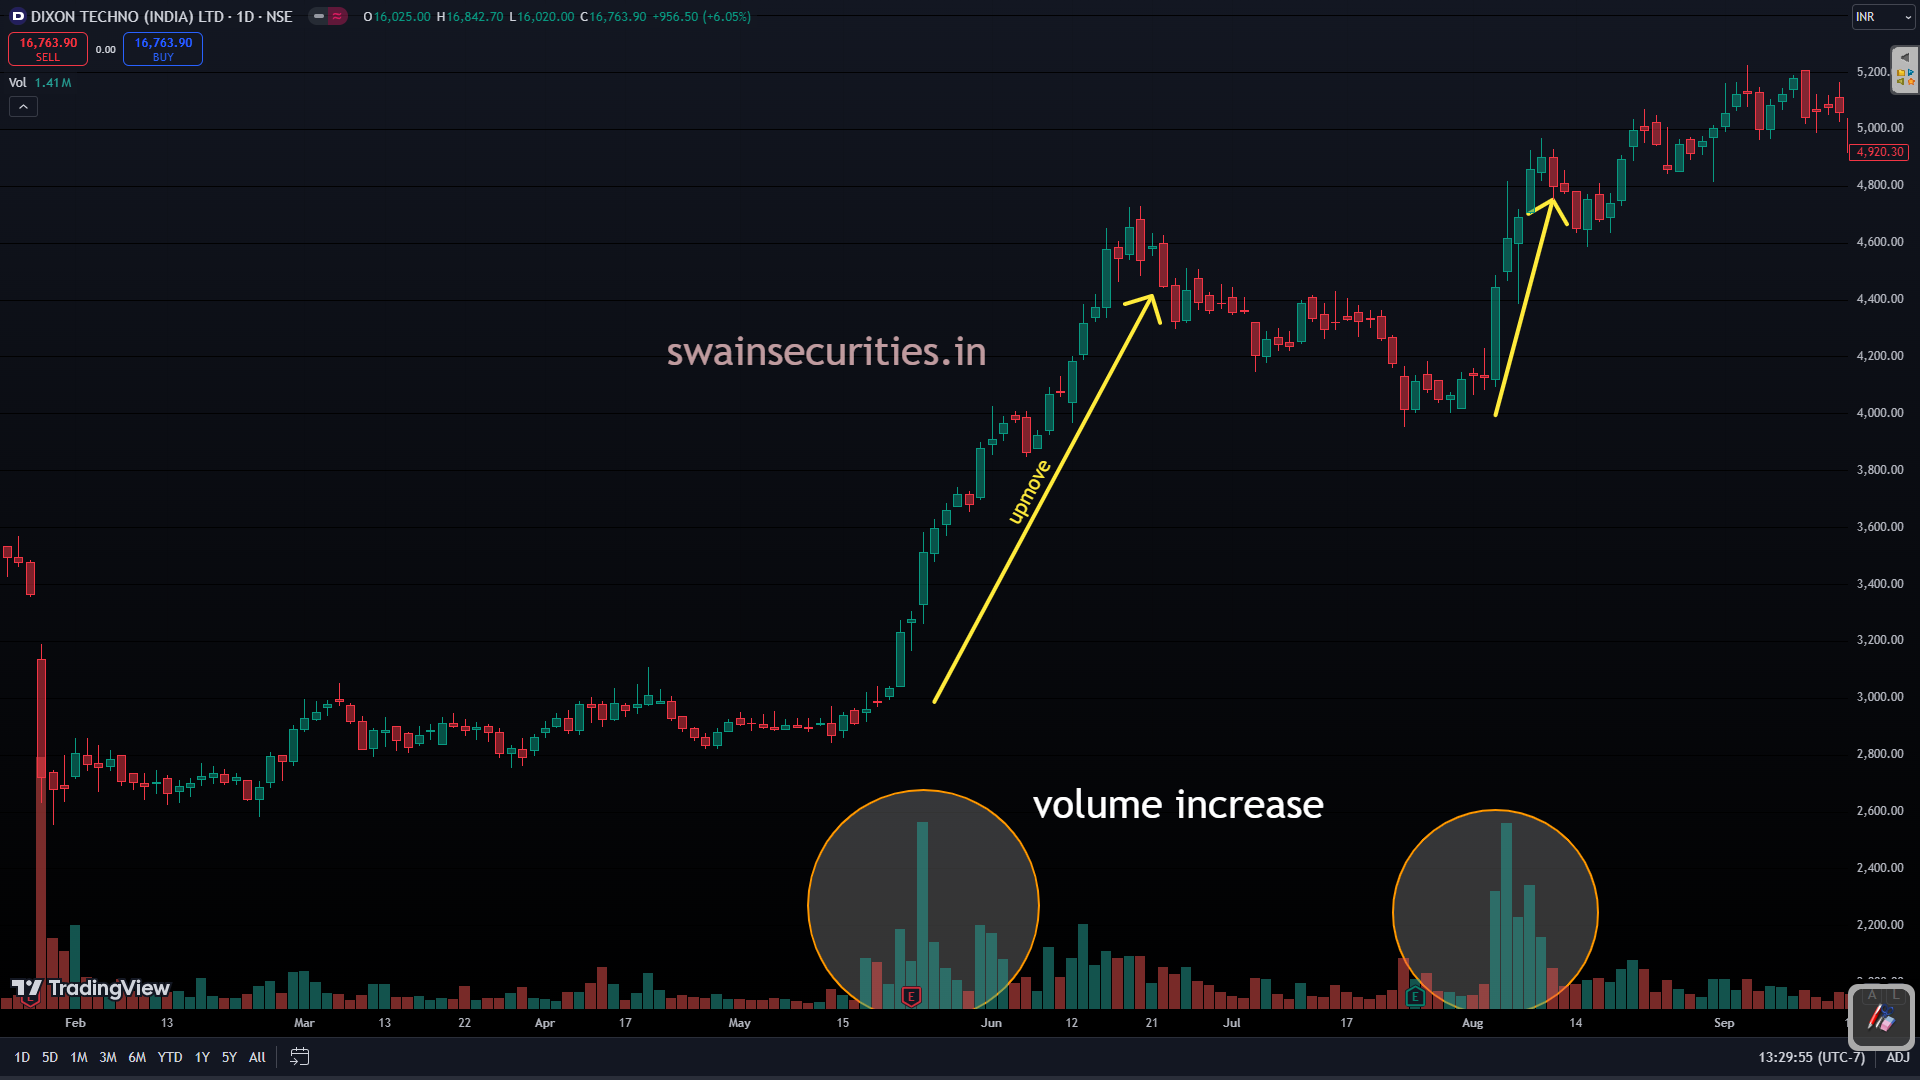
This is generally considered bullish.
It indicates:
Strong buying interest
Healthy uptrend
Trend is likely to continue
Professional traders usually prefer buying in this condition.
2. Price rise and volume decrease
This is a warning sign.
It indicates:
Weak buying
Lack of participation
Possible trend reversal
The price may continue rising temporarily, but the move lacks strength.
3. Price Down + Volume Up
This is bearish.
It shows:
Strong selling pressure
Institutional selling
Downtrend gaining strength
Traders often avoid buying during this phase.
4. Price Down + Volume Down
This usually indicates:
Selling pressure is reducing
Bears are losing control
Possible market stabilization
It may become the early stage of a reversal if buyers enter later.
How Professional Traders Use Volume Analysis
Professional traders rarely rely only on price.
They combine volume with chart patterns and technical analysis.
Some common applications include:
Confirming Breakouts
Suppose a stock breaks above an important resistance level.
If the breakout occurs with high volume, it has a higher probability of success.
If the breakout happens with low volume, it may become a false breakout.
Identifying Trend Strength
A healthy uptrend should generally show increasing volume during upward moves.
Traders become cautious if the trend continues while volume continues to decrease. Identifying Reversals Large volume near important support or resistance levels may indicate that smart money is entering or exiting the market.
This can signal a potential reversal.
Detecting Institutional Activity
Large investors such as mutual funds and institutions usually trade huge quantities.
Their buying or selling often creates unusually high volume.
Tracking these volume spikes helps traders identify where smart money may be active.
Common Volume Indicators
Although simple volume bars are useful, traders often combine them with technical indicators.
1. On Balance Volume (OBV)
OBV combines price and volume to measure buying and selling pressure.
It helps identify whether money is flowing into or out of a stock.
2. Volume Moving Average
This compares today’s volume with the average trading volume.
If current volume is much higher than average, market activity is increasing.
3. Volume Profile
Volume Profile displays where most trading has occurred at different price levels.
It helps identify:
Solid support Strong resistance
Areas of fair value
4. Accumulation/Distribution Line
This indicator attempts to determine whether institutions are accumulating or distributing shares.
Best Practices for Using Volume Analysis
To improve trading accuracy, consider the following practices:
Always analyze volume together with price.
Compare today’s volume with the average volume.
Look for unusually high volume near important support and resistance levels.
Confirm breakouts using volume.
Avoid making trading decisions based only on volume.
Combine volume with chart patterns, trend analysis, and risk management.
Common Mistakes Beginners Make
Many new traders misunderstand volume analysis.
Some common mistakes include:
Totally ignoring volume
Looking only at price often results in poor trading decisions.
Assuming High Volume Is Always Bullish
High volume can indicate both strong buying and strong selling.
Price direction must also be considered.
Trading Every Volume Spike
Not every increase in volume is meaningful.
Always check whether the volume occurs near important chart levels or significant news events.
Using Volume Without Context
Volume should always be interpreted along with:
Trend
Support and resistance
Candlestick patterns
Market sentiment
Advantages of Volume Analysis
Confirms price trends
Helps identify strong breakouts
identifies potential reversals Reveals institutional participation
Reduces false trading signals
Improves trade confidence
Works across stocks, futures, commodities, and options
The Drawbacks of Volume Analysis
Despite its usefulness, volume analysis has some limitations.
It cannot predict future prices with certainty.
A high volume does not necessarily indicate whether sellers or buyers are more powerful. News events can create misleading volume spikes.
It should never be used as a standalone trading strategy.
Successful traders always combine volume with proper technical analysis and disciplined risk management.
Conclusion
Volume analysis is one of the most valuable tools available to traders because it reveals the strength behind every price movement. While price shows the market’s direction, volume indicates the level of confidence and participation behind that move.
A rising market supported by strong volume is generally more reliable than a rally on weak volume. Likewise, heavy selling volume often signals increasing bearish pressure.
However, volume should not be used in isolation. Combining price action, chart patterns, support and resistance levels, sound risk management, and volume analysis yield the best trading decisions. By learning to interpret volume correctly, traders can improve their ability to identify high-probability opportunities and avoid many common trading mistakes.
Frequently Asked Questions (FAQs)
1. What is stock market volume analysis? The study of trading volume in conjunction with price changes to ascertain the strength, weakness, or potential direction of a market trend is known as volume analysis.
2. Why is volume important in trading?
Volume confirms whether a price movement is supported by strong participation. High volume generally indicates stronger conviction from buyers or sellers.
3. Can volume predict market direction?
While price action and volume can’t predict the future, they can help traders determine whether a trend will continue or revert.
4. Which is the best indicator for volume analysis? Some of the most popular volume-based indicators include On Balance Volume (OBV), Volume Profile, Volume Moving Average, and the Accumulation/Distribution Line.
5. How useful is volume analysis for trading options? Yes. Although options have their own volume and open interest data, analyzing the volume of the underlying stock can provide valuable insights into market sentiment and trend strength.








Leave a Reply