
Combined Price Action Trading Strategy: A Complete Guide for Beginners and Professionals
Learn about the stock market’s combined price action, how to combine it with technical analysis, and how professional traders use it in real-world trading. A complete beginner-friendly guide with examples.
Combined Price Action in Technical Analysis: The Complete Guide for Practical Trading
The stock market offers hundreds of indicators, but experienced traders know that price is the most important indicator. Every movement in the market is reflected in price. Professional traders pay close attention to Price Action Trading because of this. However, relying only on price action is not always enough. To improve accuracy, the best traders combine price action with other technical tools. This approach is known as Combined Price Action Analysis.
You will learn what combined price action is, why it works well, and how to use it in your daily trading in this guide.
How does Price Action work?
Price action is the study of a stock’s movement without depending heavily on indicators.
Instead of using many technical indicators, traders analyze:
Price fluctuation Candlestick designs Market organization Support and resistance
Swing highs and lows
The current trend The basic idea is as follows: Price tells the real story of buyers and sellers.
What is Combined Price Action?
Utilizing price action in conjunction with other tools for technical analysis to increase the likelihood of successful trades is referred to as “Combined Price Action.” Instead of depending on one signal, traders look for multiple confirmations before entering a trade.
It’s similar to solving a puzzle. A single hint is helpful. Five clues together provide much greater confidence.
Why combine technical analysis with price action? Every technical tool has limitations.
For example:
Support and resistance sometimes fail.
Candlestick patterns can be misleading. Price outpaces moving averages. RSI may remain overbought for a long time.
But when several signals point in the same direction, the chance of a successful trade increases.
This is called confluence.
Professional traders always search for confluence before taking a position.
Best Technical Tools to Combine with Price Action
1. Support and Resistance
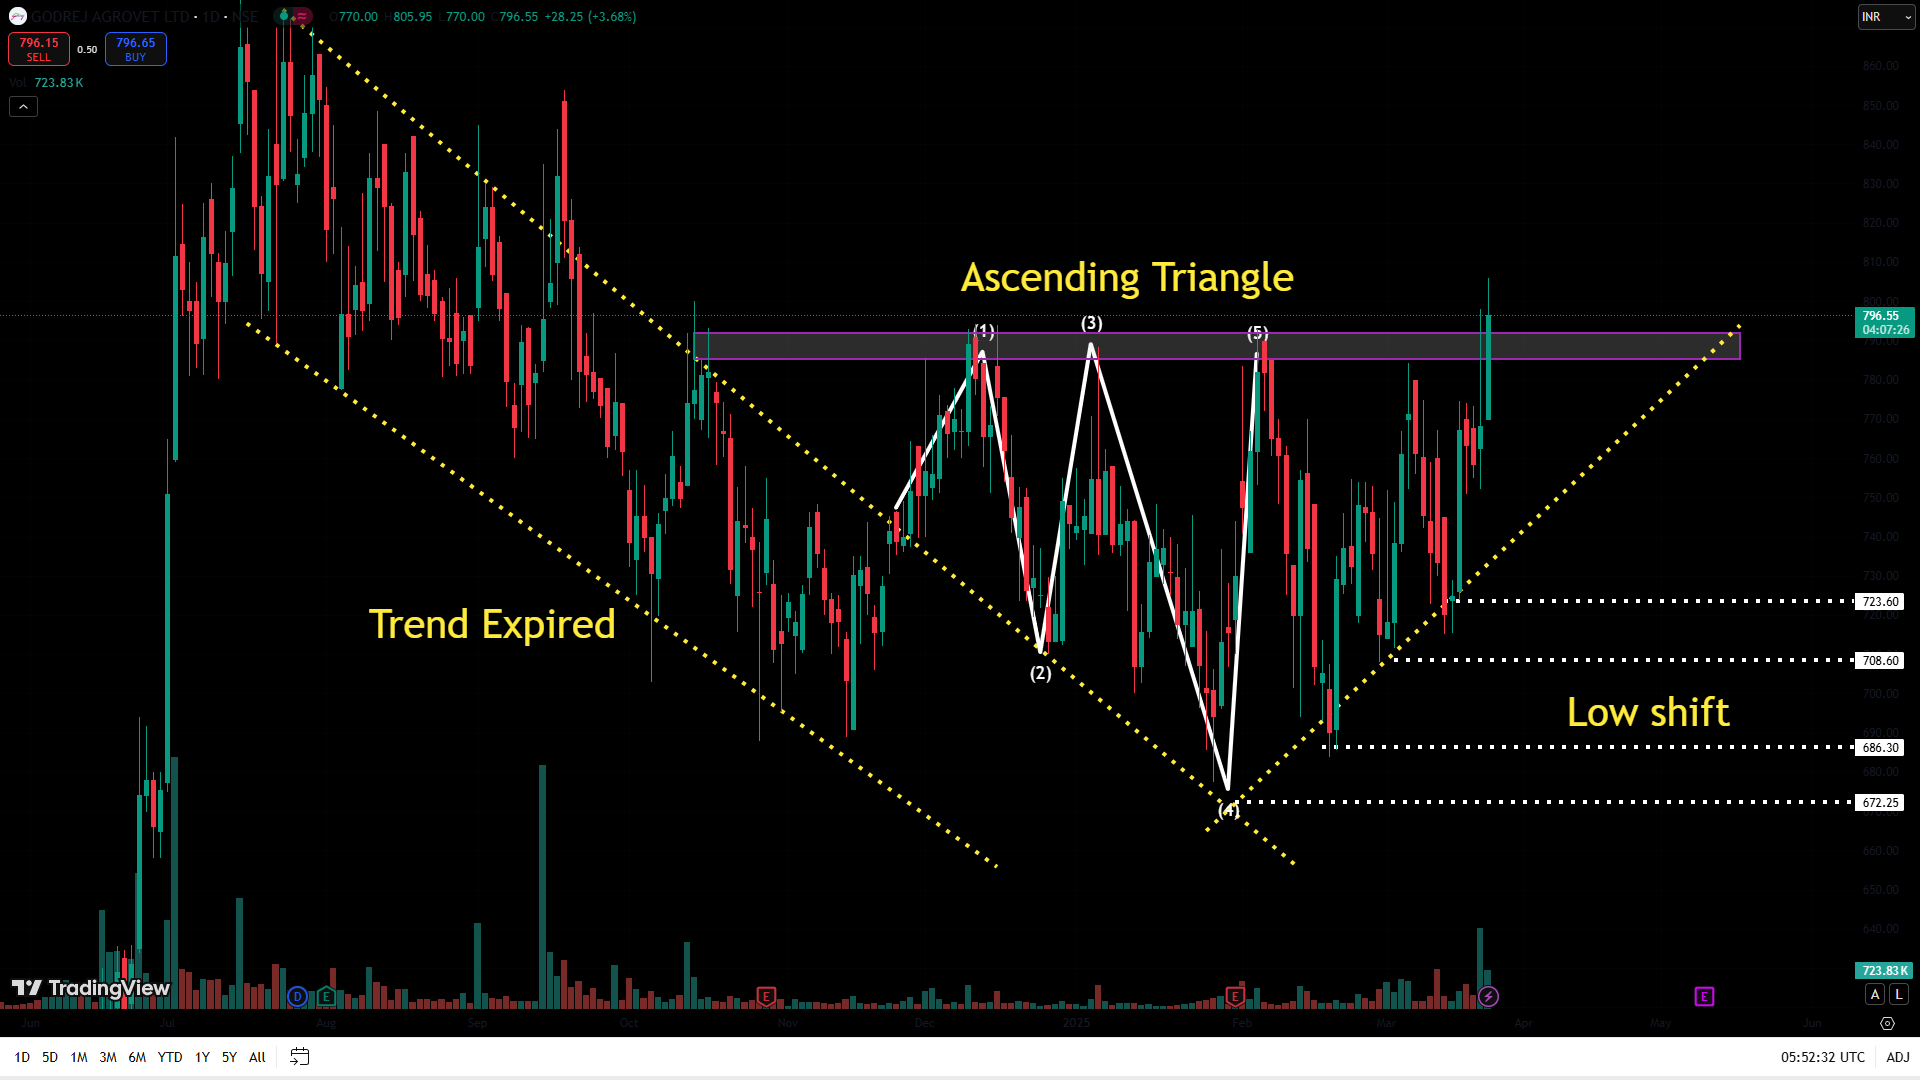
Price action is founded on the concepts of support and resistance. A bullish candle forming exactly at a strong support level has much greater importance than the same candle appearing in the middle of nowhere.
Example:
Price reaches support.
A bullish engulfing candle forms.
Buyers enter the market.
This increases the likelihood of purchasing.
2. Trend Analysis
Never trade against the major trend.
Identify whether the market is:
Uptrend
Downtrend
Sideways
Trade in the trend’s direction. For example:
If the market is making:
Higher High
Higher Low
It indicates an uptrend.
Look for buying opportunities only.
3. Moving Averages
Moving averages help identify trend direction.
Popular moving averages include:
20 EMA
50 EMA
100 EMA
200 EMA
Example:
Price pulls back to the 20 EMA.
A bullish pin bar appears.
The overall trend remains bullish.
This creates a high-probability buying setup.
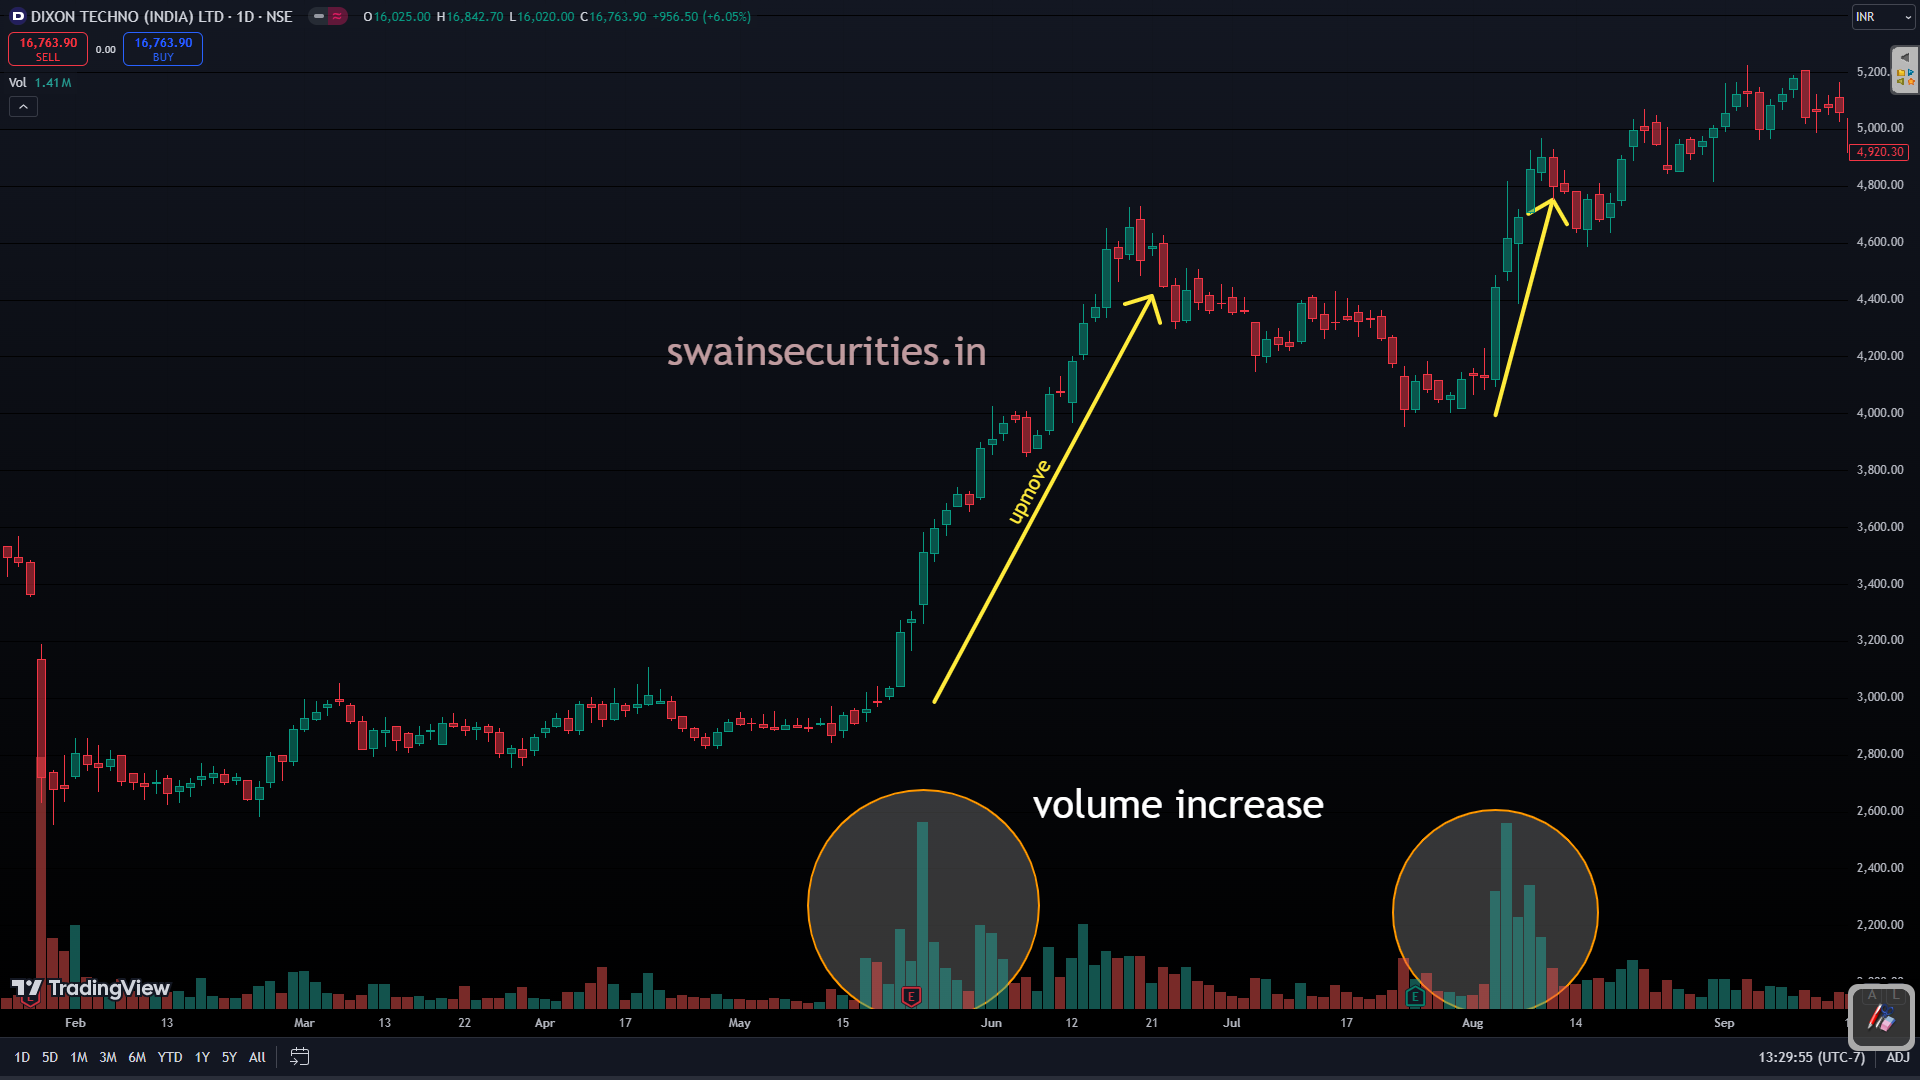
4. Analyses of Volumes
The force behind price changes can be seen in volume. Price moving higher with increasing volume indicates strong buying interest.
Price moving higher with low volume may suggest a weak rally.
Always check to see if volume supports price movement.
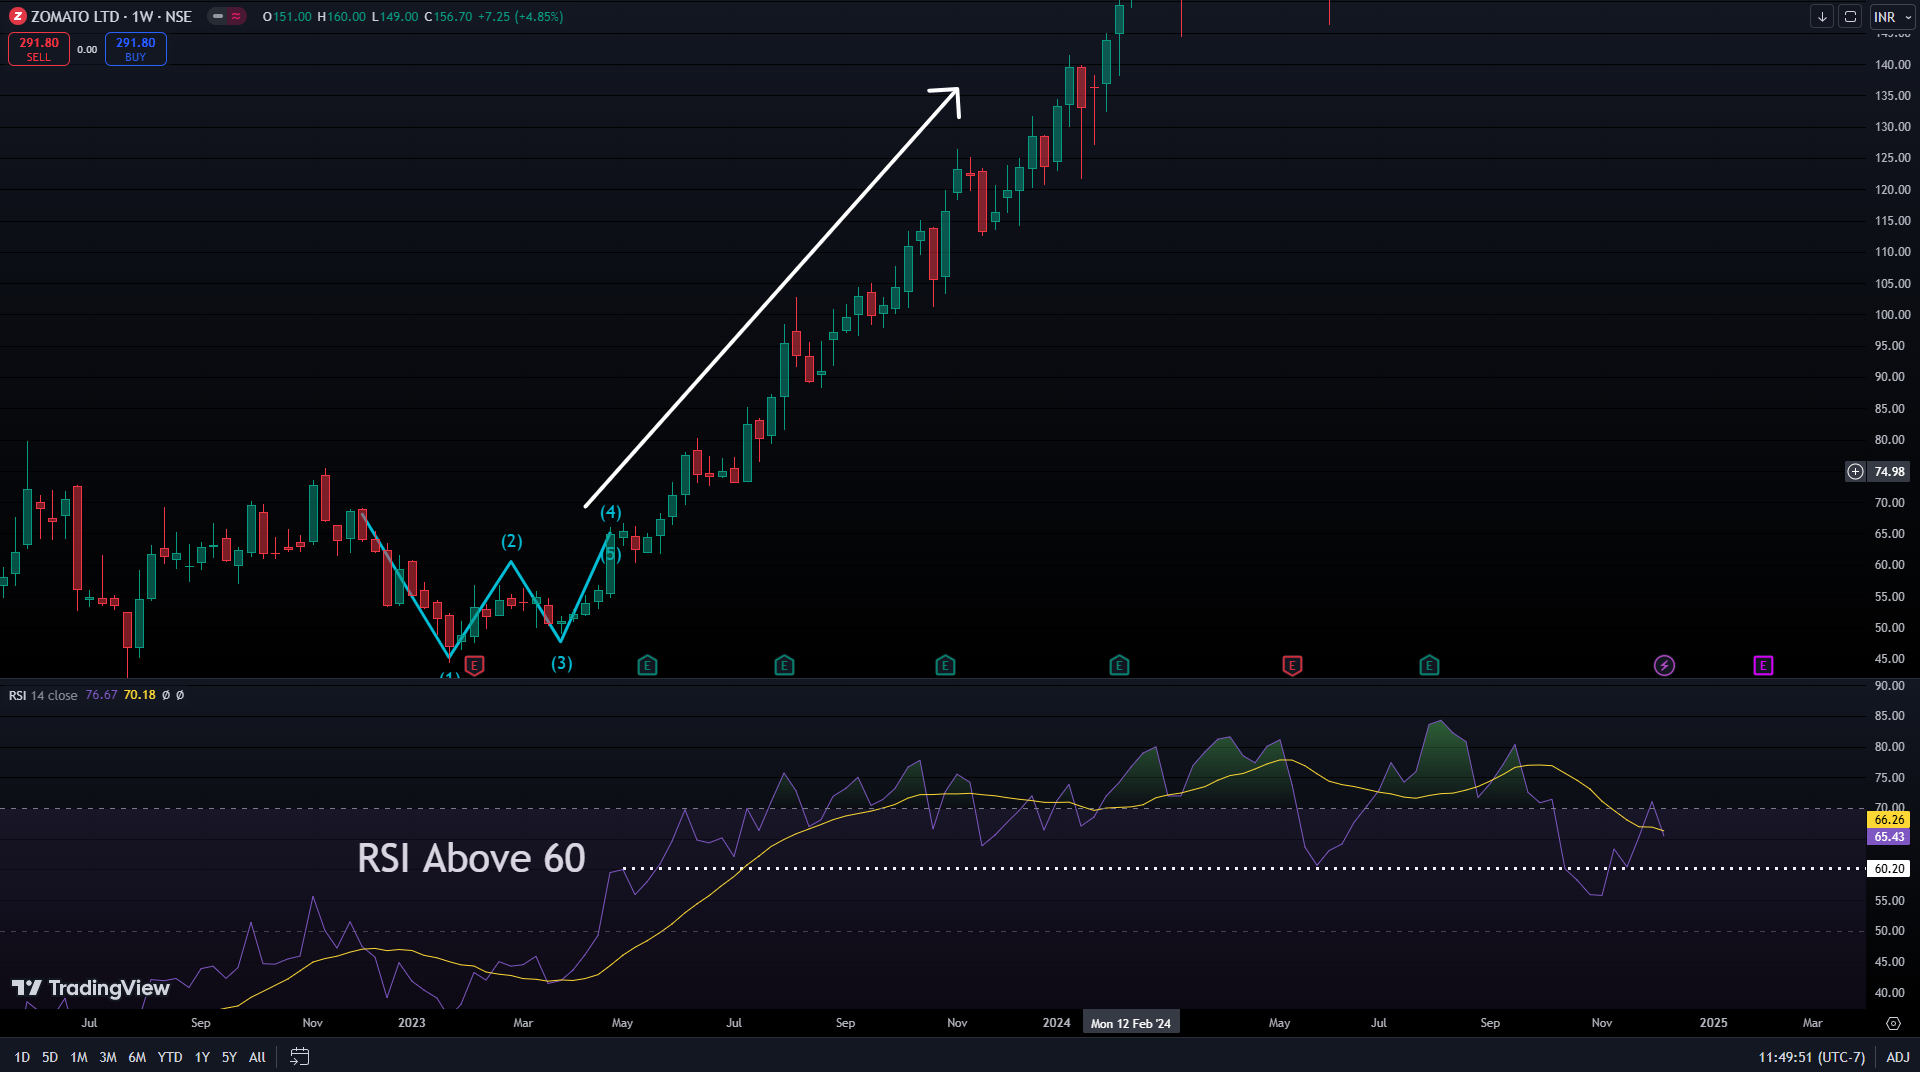
5. RSI Confirmation
Momentum is measured by RSI. Combine RSI with price action.
Example:
Price reaches support.
RSI is below 30.
Bullish engulfing candle forms.
Three confirmations together provide a stronger signal than using RSI alone.
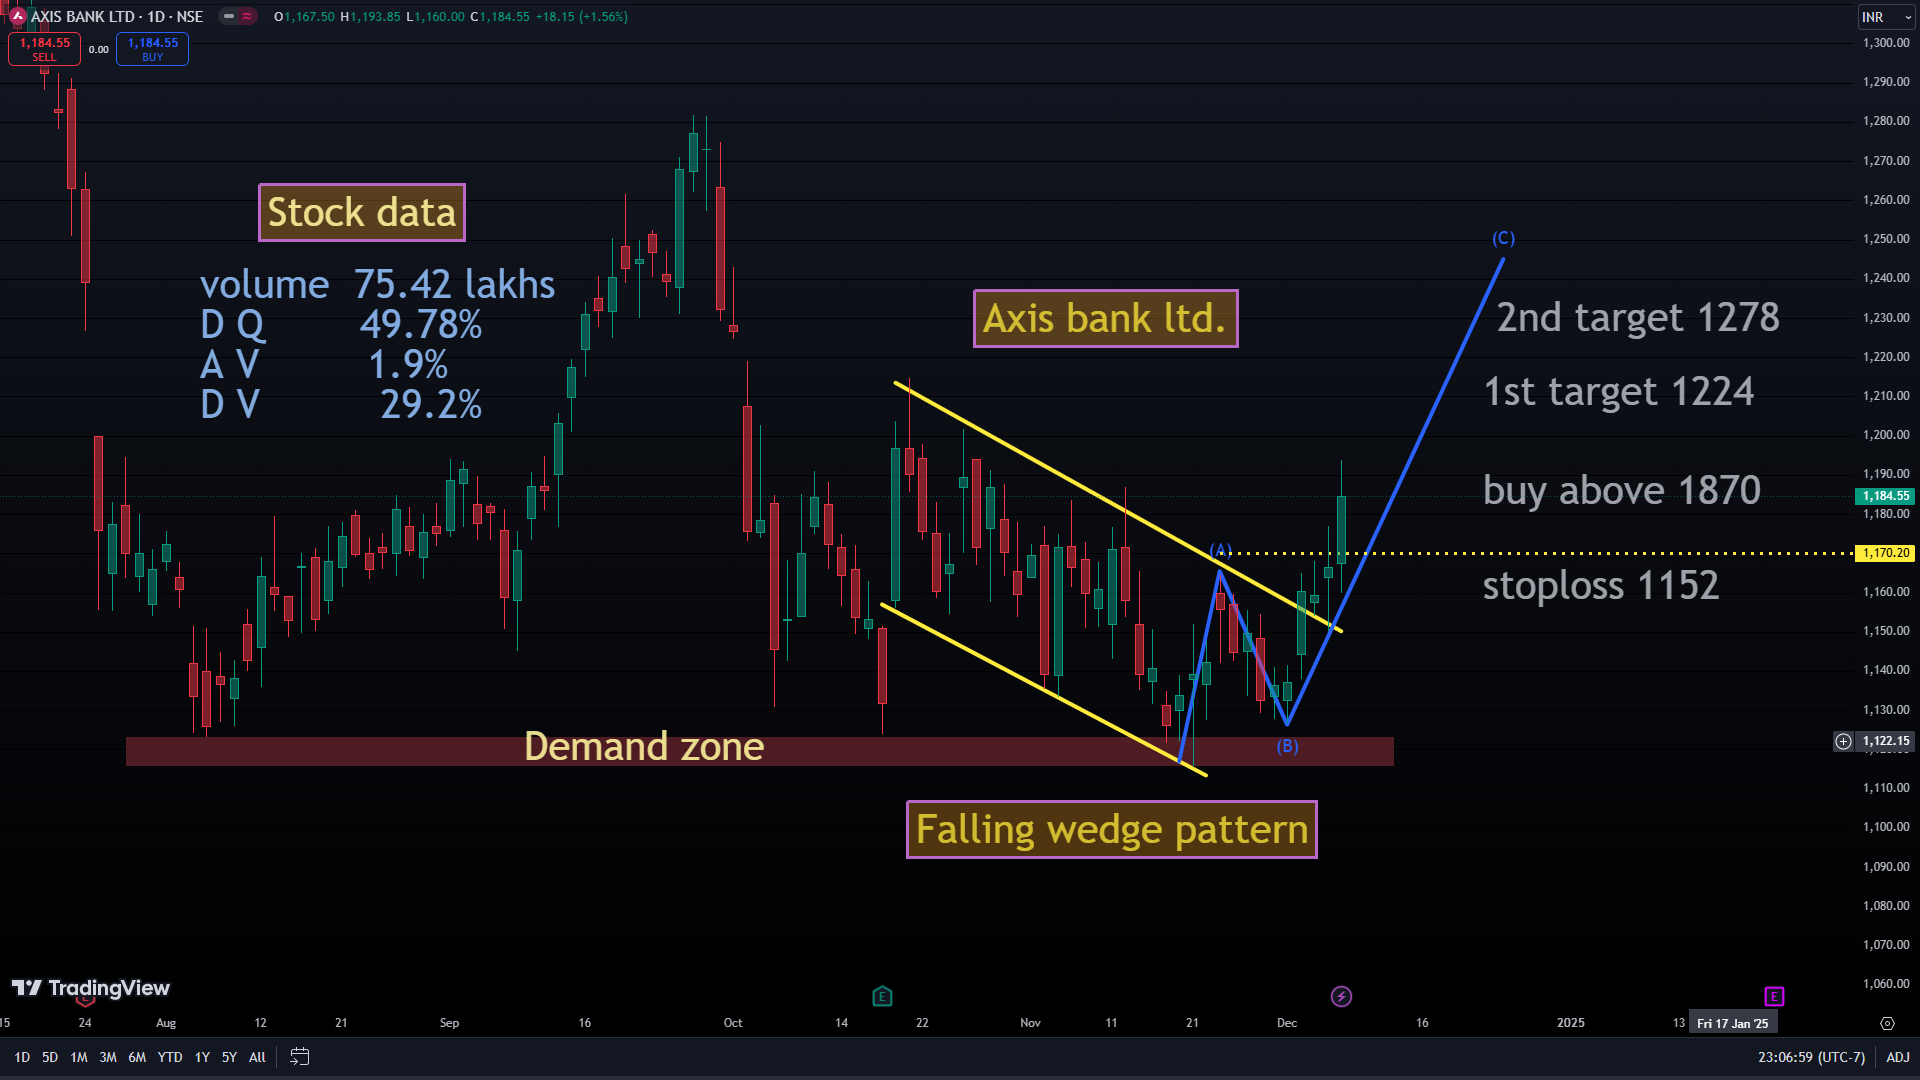
6. Demand and Supply Zones
Buyer-dominated regions are referred to as demand zones. Supply zones represent areas where sellers controlled the market.
When price reaches these zones and forms a strong reversal candlestick, it often presents an excellent trading opportunity.
7. Trendlines
Trendlines aid in the identification of fluid support and resistance. Example:
Price touches an upward trendline.
A hammer candle appears.
Volume increases.
The buy setup is strengthened by this combination.
Most Important Patterns of Price Movement
Some common patterns include:
Bar Pin Hammer
Shooting Star
Bullish Engulfing
Engulfing Bearish Inside the Bar Doji
Morning Star
Evening Star
These patterns become more reliable when supported by other technical factors.
Practical Trading Strategy Using Combined Price Action
Let’s look at a real-world example.
Step 1
Determine the general trend.
Let’s say the market is going up.
Step 2
Draw support and resistance levels.
Step 3
Hold off until the price returns to support. Do not chase the market.
Step 4
Keep an eye on the candlestick. A engulfing bullish candle appears.
Step 5
Check the volume.
The volume goes up.
Step 6
Check RSI.
RSI rises from the oversold area.
Step 7
Enter the trade.
Set the stop-loss lower than the most recent swing low.
Step 8
Set your target.
Aim for the next resistance level or use a minimum Risk-Reward Ratio of 1:2.
An Illustration of Combined Price Action
Let’s say a stock is going for $500. Trend is upward.
Price retraces to ₹480 support.
20 EMA is close to 480. The RSI reaches 35 and begins to rise. A engulfing bullish candle appears. There is more volume than usual.
This setup provides several confirmations:
✔ Uptrend
Provide Aid
✔ Moving Average
✔ RSI
✔ Bullish Candlestick
✔ Strong Volume
Instead of relying on a single signal, you now have multiple reasons to enter the trade.
Advantages of Combined Price Action
Higher probability trades
Better entry timing
Improved stop-loss placement
increased self-assurance Fewer false signals
Improved comprehension of market psychology Suitable for intraday, swing, and positional trading
Common Errors Made by Traders
Many beginners make these errors:
Trading every candlestick pattern.
Ignoring the trend.
Not checking volume.
Using too many indicators.
Entering trades without confirmation.
Risking too much on a single trade.
Ignoring stop-loss.
Avoid these mistakes to improve your trading discipline.
Risk Management Rules
Even the best strategy cannot guarantee success.
Always follow these rules:
Risk only 1–2% of your trading capital on a single trade.
Always use a stop-loss.
Keep the minimum risk-reward ratio at one to one. Avoid emotional trading.
Review your decisions by keeping a trading journal. Wait for confirmation instead of guessing market direction.
Good risk management is what keeps traders in the market over the long term.
Is Combined Price Action Suitable for Beginners?
Yes. Beginners can learn it because it focuses on understanding how price behaves rather than relying on many indicators.
Start with:
Market organization Support and opposition Candlestick designs Trend identification
For more solid confirmation, gradually introduce tools like demand-supply zones, volume, moving averages, and the RSI once you feel confident.
Conclusion
Because it combines price behavior with technical confirmation, combined price action is one of the most effective methods for analyzing the stock market. Rather than making decisions based on a single indicator, traders look for multiple signals—such as trend, support and resistance, candlestick patterns, volume, RSI, and moving averages—to improve the quality of their trades.
No strategy wins every time, but combining price action with sound risk management, patience, and discipline can significantly improve your consistency. Whether you trade intraday, swing, or positionally, mastering combined price action can help you make better trading decisions with more confidence.








Leave a Reply