
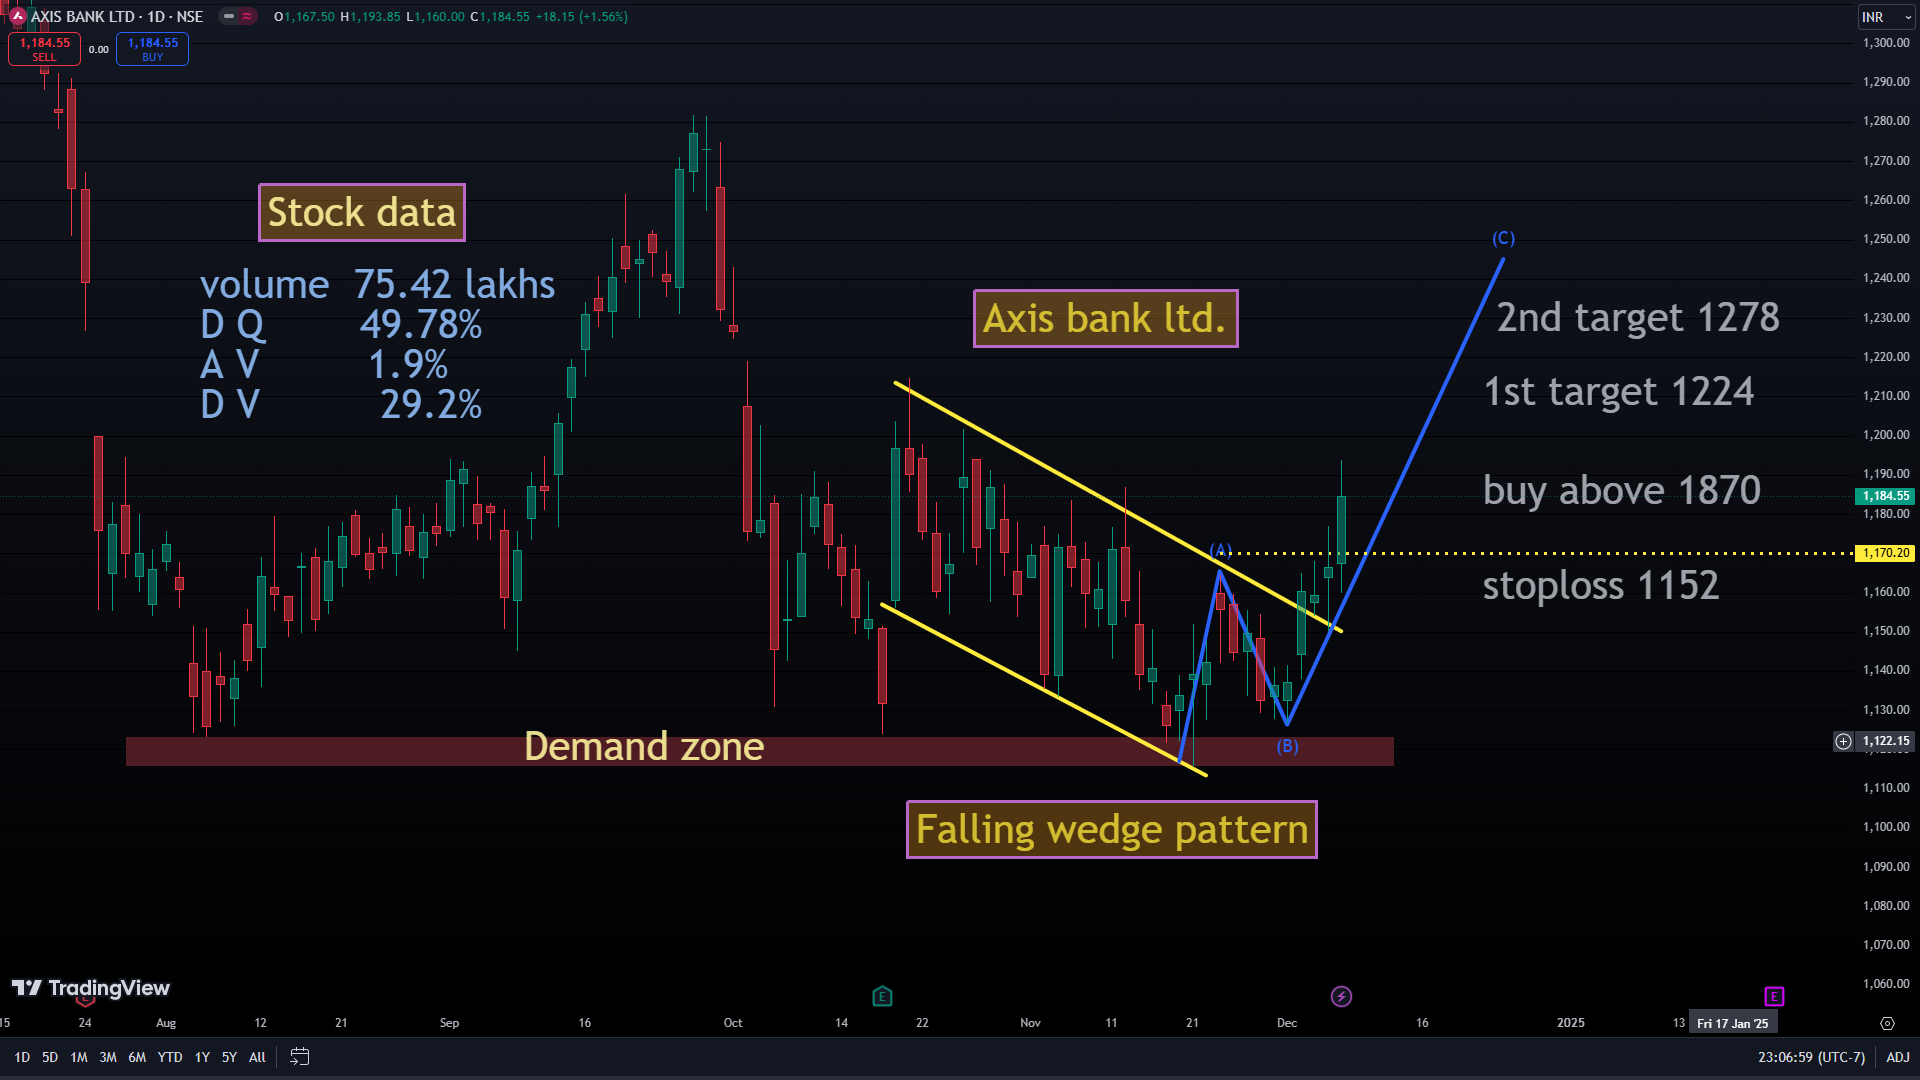
Demand and Supply Trading Strategy
Demand and Supply in the Stock Market: A Complete Beginner’s Guide to the Demand and Supply Trading Strategy
Introduction
Every movement in the stock market—whether prices rise, fall, or move sideways—is driven by one simple principle: Demand and Supply.
Many traders spend years learning complex indicators like RSI, MACD, Bollinger Bands, and Moving Averages. These instruments are useful, but they all look at price after it has already changed. The reasons for price changes are the primary focus of Demand and Supply. If you understand where buyers and sellers are likely to enter the market, you can often make better trading decisions with fewer indicators.
In this article, you’ll learn:
What demand and supply mean in the stock market
How prices move because of demand and supply
What demand and supply zones are
How to identify them on a chart
A beginner-friendly demand and supply trading strategy
Common mistakes traders make
Tips for managing risks
What is Demand in the Stock Market?
Demand refers to the buying interest for a stock.
The price of a stock goes up when a lot of investors want to buy it and only a few people want to sell it. Imagine a popular smartphone launching with limited stock. Thousands of people want to buy it, but only a few units are available. The price naturally increases.
The stock market is the same way.
Simple Example
Suppose ABC Ltd. is trading at ₹500.
Many buyers believe the stock will reach ₹600.
Buyers start placing purchase orders.
Sellers become fewer.
Buyers compete with each other.
Consequently, the stock price rises. Higher demand generally leads to higher prices.
What is Supply in the Stock Market?
Supply means the selling interest in a stock.
The stock price decreases when a large number of investors wish to sell while fewer buyers are available. For example:
XYZ Ltd. trades at ₹800.
Suddenly, poor quarterly results are announced.
Investors rush to sell thousands of shares. There are only a few buyers interested. The increased selling pressure pushes the price lower.
Higher supply generally leads to lower prices.
How do supply and demand interact?
The stock market is like an auction.
Buyers want the lowest price.
Sellers want the highest price.
A trade happens only when both agree on a price.
When buyers dominate, prices rise.
When sellers dominate, prices fall.
When buying and selling are balanced, prices move sideways.
Why Does Price Reverse at Certain Levels?
Professional traders, mutual funds, banks, and institutional investors trade with very large orders.
It is not always possible to complete these massive orders immediately. Instead, institutions often accumulate or distribute positions around specific price levels.
Because of this: Strong buying creates Demand Zones
Supply Zones are created by strong selling. When price returns to these areas later, buyers or sellers may become active again, increasing the probability of a reaction.
What is a Demand Zone?
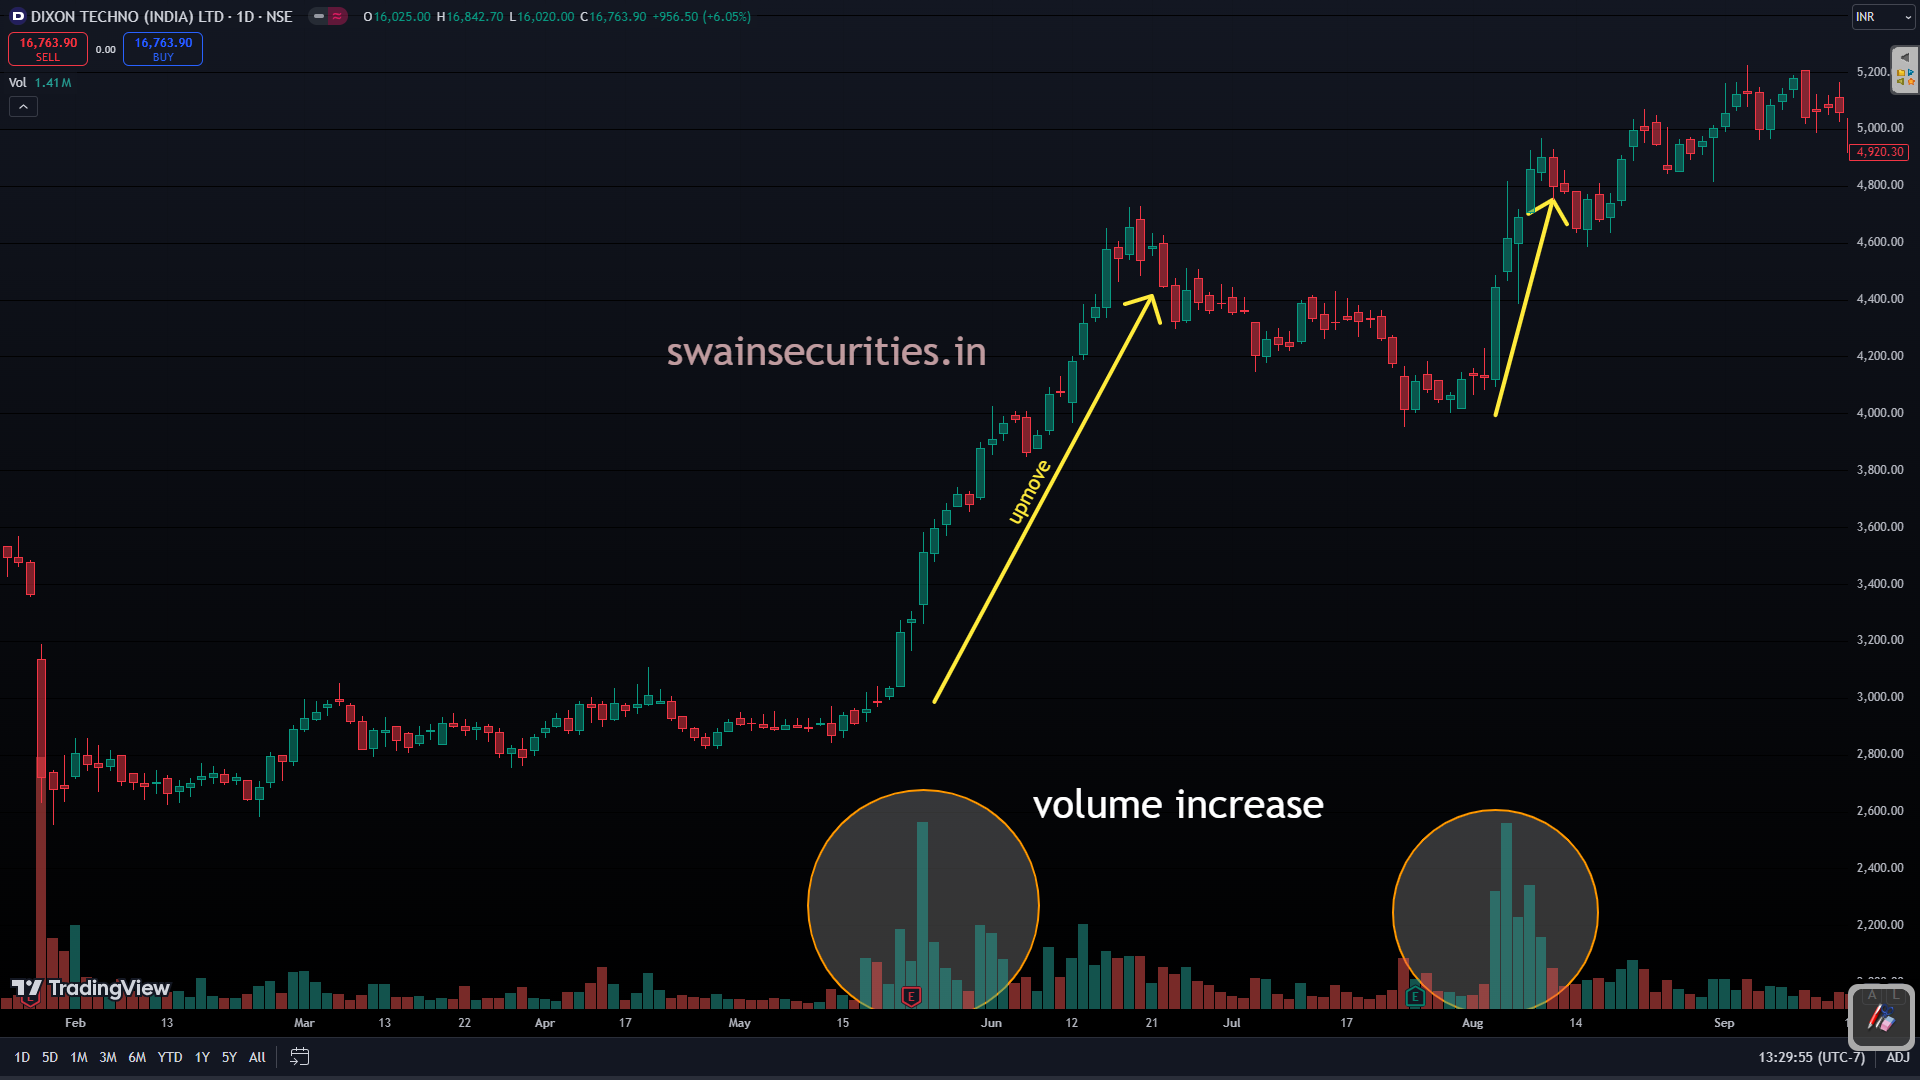
A price range where buyers have previously aggressively entered the market is known as a demand zone. When price revisits this area, buyers may become active again.
Among the characteristics are: Strong bullish candle after consolidation
High buying momentum
Sharp upward move
Support emerges frequently from resistance in the past. Frequently, demand zones serve as support.
What is a Supply Zone?
A price range where sellers have previously entered aggressively is known as a supply zone. It’s possible that sellers will once again dominate when price reaches that level. Characteristics include:
Strong bearish candle
Sharp fall after consolidation
a lot of selling pressure Previous support becomes resistance
Supply zones often act as resistance.
How to Identify Demand Zones
A quality demand zone usually has these features:
1. Sideways Movement
Price pauses briefly.
2. Strong Bullish Breakout
Large green candles appear.
3. Rally for Quick Prices. The stronger the move away, the stronger the zone may be.
4. Fresh Zone
A zone that has not been tested multiple times is often considered more reliable than one that has been revisited repeatedly.
How to Identify Supply Zones
Look for:
Sideways movement
Strong bearish candle
Sharp decline
Fresh selling area
The supply zone may be stronger the stronger the fall.
Patterns of Supply and Demand
1. Rally – Base – Rally (RBR)
Price rises.
Creates a base.
Moves higher again.This frequently indicates ongoing interest in purchasing.
2. Drop – Base – Drop (DBD)
Price decreases. Creates a base.
Falls again.
This frequently indicates that selling pressure is ongoing.
3. Rally, Base, and Drop (DBR).
Price declines.
Forms a base.
ascends in reverse. A demand zone is frequently identified using this pattern.
4. Rally – Base – Drop (RBD)
Price goes up. Creates a base.
Reverses downward.
This pattern is commonly used to identify a supply zone.
Demand and Supply Trading Strategy
Here is a simple strategy suitable for beginners.
Step 1: Choose the Timeframe
Swing traders often use:
Daily Chart
4-Hour Chart
Intraday traders may use:
15-Minute Timeline 5-Minute Timeline
Step 2: Look for the Strong Zones Search for: Explosive actions Large candles
a lot of momentum Limited time spent at the base
Step 3: Wait for Price to Return
Avoid chasing the market.
Instead, be patient and wait for price to return to the designated zone.
Step 4: Seek Acknowledgement Possible confirmation signals include:
Bullish engulfing candle
Engulfing bearish candle Pin bar
Strong rejection candle
Increase in trading volume
Although no signal guarantees success, confirmation can help reduce false entries.
Step 5: Get in on the Deal For Demand Zone:
Buy near the demand zone after confirmation.
For Supply Zone:
Sell (or consider a short position where permitted) near the supply zone after confirmation.
Step 6: Place Stop Loss
Always place your stop loss beyond the demand or supply zone to help limit potential losses if the market moves against your trade.
Step 7: Set Target
Common approaches include:
Previous swing high or swing low
Nearby support or resistance
Risk-to-reward ratio of at least 1:2, meaning the potential reward is at least twice the amount you are risking.
Example
Suppose a stock moves:
₹950 → ₹970
Then it trades sideways between 975 and 9700. Suddenly it jumps to ₹1,020.
The ₹970–₹975 area becomes a possible demand zone.
If price returns to 972 and forms a strong bullish reversal candle a few weeks later, some traders may consider it an opportunity to buy, provided that their trading plan and risk management guidelines support it.
Advantages of Demand and Supply Trading
Simple to comprehend Uses price action rather than many indicators
Can be applied to stocks, futures, options, forex, and commodities
aides in the identification of potential institutions’ active regions Works across multiple timeframes
Common Mistakes
Trading in All Regions Not every zone leads to a reversal.
Focus on strong, fresh zones.
Ignoring Market Trend
Trading against a strong trend can increase risk.
No Loss Limits Risk management is essential.
Chasing Price
Patience is important.
Hold off until price returns to your zone. Overtrading
Quality setups usually outperform frequent trades.
Advice for Managing
Risk On a single trade, you should only put 1–2% of your trading capital at risk. Avoid making emotional choices. Consistently follow your trading plan. Keep a trading journal.
Never risk money you cannot afford to lose.
Is it better to use demand and supply than indicators?
Neither approach is universally better.
Demand and Supply focuses on where price may react, while indicators often focus on how price has behaved.
Instead of relying solely on one strategy, many seasoned traders employ a combination of demand and supply analysis, trend analysis, volume, or one or two indicators.
Conclusion
Because it focuses on the equilibrium that exists between buyers and sellers—the force that ultimately drives price movement—demand and supply is one of the technical analysis concepts that is most applicable to real-world situations. Traders can make more structured decisions by learning to identify strong demand and supply zones, waiting for confirmation, and carefully managing risk. However, like every trading method, it has limitations and should be practiced on historical charts or in a simulated environment before being used with real capital.
Successful trading is not about predicting every market move. It is about following a disciplined process, controlling risk, and staying consistent over time.
Frequently Asked Questions (FAQs)
Q1. What is demand in the stock market?
Demand is the willingness of buyers to purchase a stock. When demand is greater than supply, prices generally rise.
Q2. What is a demand zone?
A demand zone is a price area where buying interest previously caused a strong upward move and may attract buyers again.
Q3. How does a supply zone work? A supply zone is a price area where selling pressure previously caused a strong decline and may attract sellers again.
Q4. Is the demand-supply strategy appropriate for novices? Yes. Its concepts are relatively straightforward, but beginners should practice on historical charts or paper trading before risking real money.
Q5. Can this strategy be used in options trading?
Yes. Some traders use demand and supply analysis to identify likely price reaction areas in the underlying asset before selecting options strategies. Options involve additional variables like implied volatility and time decay, so these should also be taken into account.








Leave a Reply