
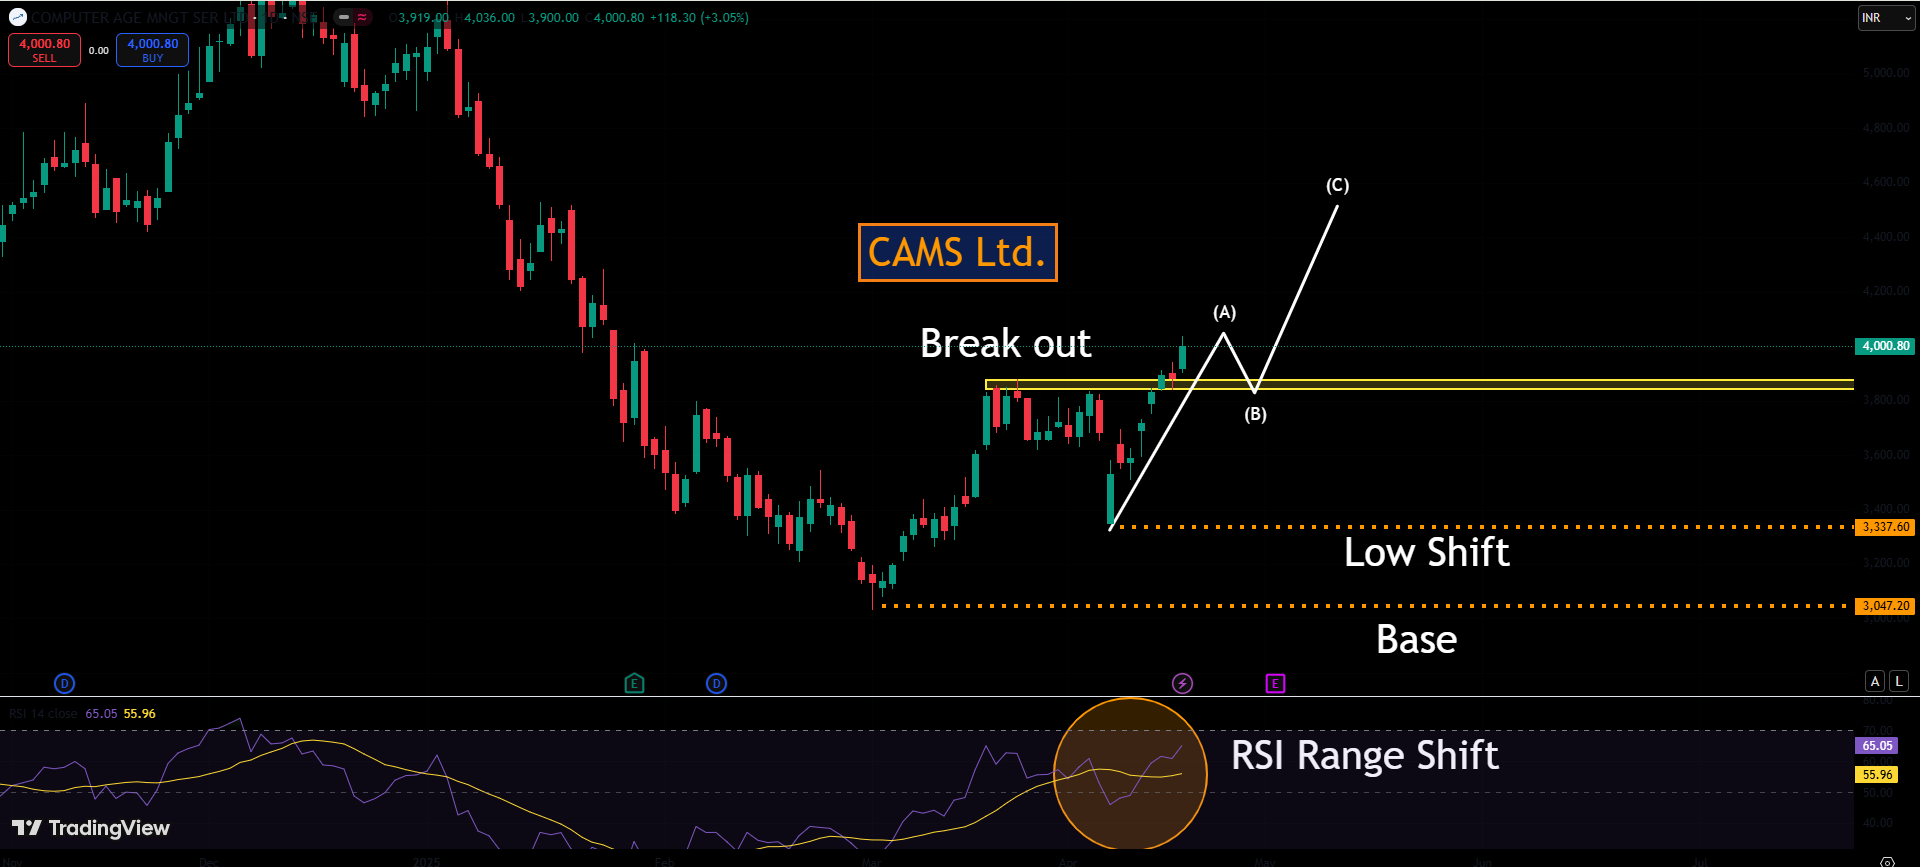
5 High Accuracy Trading Indicators
Stock Market Indicators: A Simple Guide for Equity and Options Traders
Learn what stock market indicators are and discover the most important indicators for equity and options trading. This beginner-friendly guide explains technical indicators in simple language with real-life examples.
Stock Market Indicators: The Beginner’s Guide to Smarter Trading
If you are new to the stock market, you may have heard traders talking about RSI, MACD, Moving Average, VWAP, or Bollinger Bands. These are called stock market indicators.
A lot of inexperienced people believe that indicators can predict the future. The facts are different. Indicators do not predict the market. They simply help traders understand what is happening in the market and make better trading decisions.
In this article, you will learn what stock market indicators are, why they are important, and which indicators are most useful for equity and options trading—all explained in very simple words.
What Are Stock Market Indicators?
A stock market indicator is a mathematical calculation based on a stock’s price, volume, or open interest. It helps traders understand:
Whether the price is going up or down
Whether buyers or sellers are stronger
Whether the market is overbought or oversold
Whether or not a trend is likely to change Think of indicators like the speedometer in a car.
The vehicle is not driven for you by a speedometer. It only tells you how fast you are moving. In the same way, market indicators don’t make you money; rather, they give you information that helps you make better decisions.
What Are the Importance of Stock Market Indicators?
Without indicators, traders often make decisions based on emotions like fear and greed.
Indicators help traders:
Identify trends
Find buying opportunities
Find opportunities to sell. Manage risk
Avoid emotional trading
Improve consistency
However, no indicator is 100% accurate. The combination of indicators, effective risk management, and price action makes successful traders.
Types of Stock Market Indicators
There are four main types.
1. Trend Detectors.
These show the direction of the market.
Examples:
Average Moving (MA) Exponential Moving Average (EMA)
MACD
2. Momentum Indicators
These measure the strength of price movement.
Examples:
RSI
Stochastic Oscillator
3. Volume Indicators
These show whether buyers or sellers are active.
Examples:
VWAP
On-Balance Volume (OBV)
4. Volatility Indicators
These measure how much prices are moving.
Examples:
Bollinger Bands
Average True Range (ATR)
Most Important Stock Trader Indicators. Let’s understand the indicators that every equity trader should know.
1. Moving Average (MA)
Ideal for: Recognizing trends A Moving Average shows the average price of a stock over a certain number of days.
Common periods:
20-day
50-day
100-day
200-day
Simple Example
Let’s say a stock has been closing in the $100 range each day. The 20-day Moving Average will also be close to ₹100.
If the stock price moves above the Moving Average, it usually indicates strength.
If it falls below the Moving Average, it may indicate weakness.
Why Traders Like It
Easy to understand
Helps identify trends
Good for beginners
2. Exponential Moving Average (EMA)
EMA is similar to the Moving Average but gives more importance to recent prices.
Popular EMAs:
9 EMA
20 EMA
50 EMA
EMA is preferred by many intraday traders due to its quicker response to price changes.
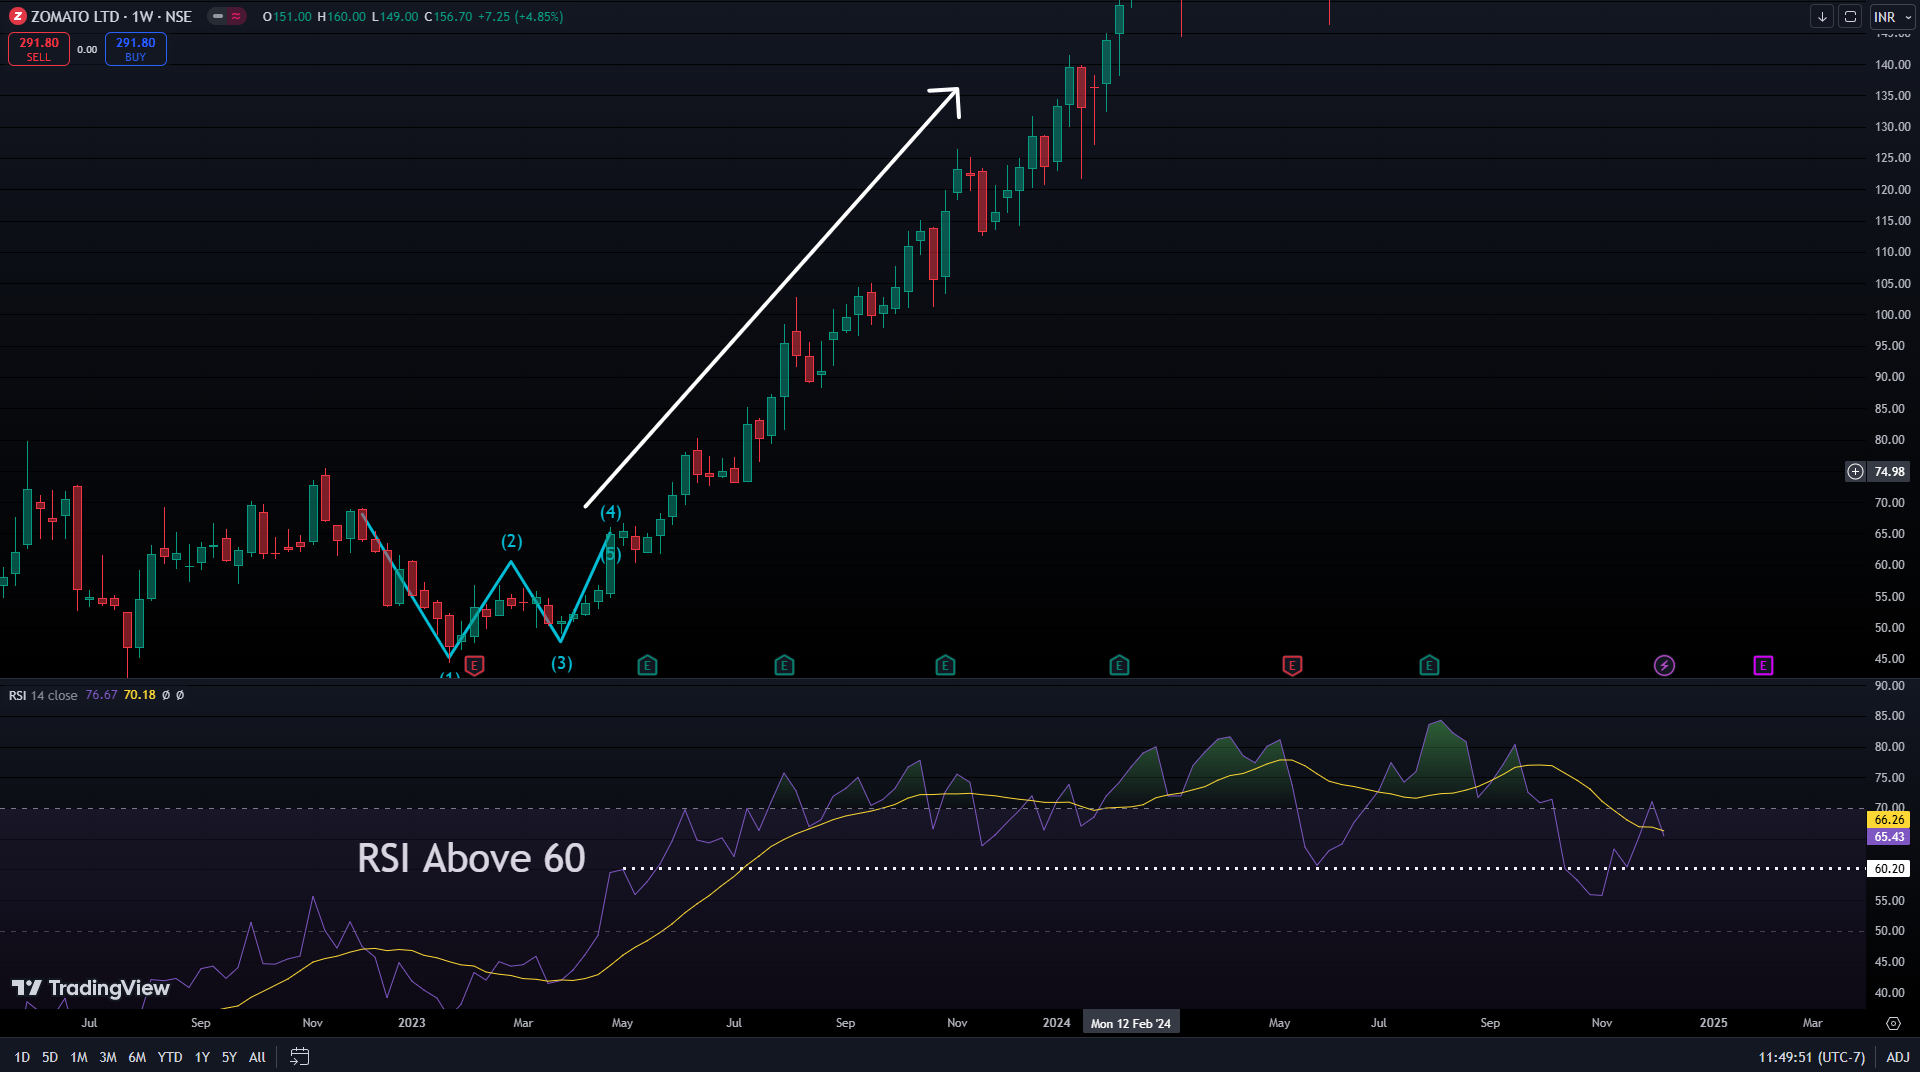
3. Relative Strength Index (RSI)
Best for: Identifying conditions of oversold and overbought RSI ranges from 0 to 100.
General interpretation:
Overbought: above 70 Oversold below 30 Example
Imagine a stock has been rising continuously for several days.
Its RSI may reach 75.
This means the stock has risen quickly and may pause or correct. It does not guarantee that the price will fall.
Similarly, an RSI below 30 suggests the stock has fallen sharply and may recover, but confirmation from price action is important.
4. MACD (Moving Average Convergence Divergence)
MACD helps identify changes in momentum and trend.
It consists of:
MACD Line
Signal Line
Histogram
Basic Rule
MACD crosses above the Signal Line = Possible bullish signal
When MACD falls below the Signal Line, it could be a bearish sign. Many swing traders use MACD to confirm trend changes.
5. VWAP (Volume Weighted Average Price)
VWAP stands for Volume Weighted Average Price.
It is one of the most popular indicators among intraday traders.
It shows the average price considering both price and trading volume.
General Interpretation
Price above VWAP = Buyers are stronger
Price below VWAP = Sellers are stronger
Many professional traders use VWAP to judge intraday strength.
6. Banding Techniques Bollinger Bands measure market volatility.
They have three lines:
Upper Band
Middle Band
Lower Band
When the bands widen, volatility increases.
When the bands become narrow, the market is relatively quiet.
Most Important Indicators for Options Traders
Options trading requires understanding both price direction and market activity.
Here are the most useful indicators.
1. Open Inquiry (OI).
Open Interest is one of the most important indicators for options traders.
It tells us how many option contracts are currently active.
Why it’s important High Open Interest often indicates important support or resistance areas.
Example:
High Call OI may act as resistance.
High Put OI may act as support.
2. India VIX
India VIX measures market volatility.
Traders typically anticipate larger price swings when the VIX is higher. Lower VIX usually indicates calmer market conditions.
Options premiums are often influenced by changes in volatility.
3. RSI
RSI is equally useful in options trading.
Many traders use RSI to avoid buying options when the underlying asset appears overextended, while remembering that RSI alone should not be the basis for a trade.
4. VWAP
VWAP enables traders to determine during the trading session whether buyers or sellers are in control of the market for intraday options trading. 5. Moving Average
Many options traders use the 20 EMA or 50 EMA to determine the overall trend before selecting Call or Put options.
Can One Indicator Guarantee Profit?
The simple answer is No.
There is no global indicator that promises profits. There are limitations to every indicator. Even professional traders experience losing trades.
Success in trading depends on:
Following a trading plan
Managing risk
Using stop-loss orders
Maintaining discipline
Practicing patience
Your decisions should be supported rather than overridden by indicators.
Best Indicator Combinations
Many experienced traders combine indicators instead of relying on only one.
Some common combinations include:
Trend Trading
- 20 EMA
- RSI
Intraday Trading
- VWAP
- RSI
Swing Trading
- MACD
- 50 EMA
Options Trading
- Open Interest
- VWAP
- India VIX
Using multiple indicators can help confirm a trading idea, but adding too many may create confusion.
Common Mistakes Beginners Make
Avoid these common errors:
- Using too many indicators on one chart
- Ignoring stop-loss levels
- Trading based only on indicator signals
- Entering trades without a clear plan
- Letting emotions control decisions
Keeping your strategy simple is often more effective.
Tips for Beginners
If you are just starting your trading journey:
Learn one indicator at a time.
Before putting real money at risk, practice on historical charts. Combine price action and indicators. Focus on risk management rather than chasing quick profits.
Keep a trading journal to learn from every trade.
Final Thoughts
Stock market indicators are valuable tools that help traders understand trends, momentum, volume, and volatility. They make chart analysis easier but cannot predict the future with certainty.
For equity traders, indicators such as Moving Average, EMA, RSI, MACD, VWAP, and Bollinger Bands are among the most widely used.
For options traders, Open Interest, India VIX, VWAP, RSI, and Bolinger Band.
For options traders, Open Interest, India VIX, VWAP, RSI, and Moving Averages provide useful insights into market conditions and potential trading opportunities.
The most successful traders do not rely on a single indicator. They combine technical analysis with sound risk management, discipline, and continuous learning.
Remember, in the stock market, consistency is built through knowledge, patience, and practice—not by searching for a “perfect” indicator.
Frequently Asked Questions (FAQs)
1. What is the best indicator for beginners?
The Moving Average is one of the easiest indicators to learn because it clearly shows the market trend.
2. Which indicator is best for intraday trading?
Many intraday traders use VWAP along with RSI and EMA to assess trend and momentum during the trading session.
3. Is RSI accurate?
RSI is a helpful momentum indicator, but it is not always accurate on its own. It should be used with price action or other indicators for better decision-making.
4. Which indicator is most important for options trading?
Open Interest is widely followed by options traders because it provides information about active positions and potential support or resistance zones.
5. Can I trade using only one indicator?
It is possible, but relying on a single indicator increases the chance of false signals. Combining indicators with proper risk management generally leads to more informed trading decisions.




Leave a Reply